MIMXRT595-EVKのスタート・ガイド
このドキュメントの内容
-
接続
-
ソフトウェアの入手
-
ビルドと実行
-
SDKサンプルの変更
サインイン 進行状況を保存するには アカウントをお持ちでない方 アカウントを作成する。
お客様の RT595評価キット
1. 接続
MIMXRT595-EVKを実際に使ってみましょう。ショート・ビデオで手順を視聴するか、以下に記載された詳細な手順を参考にして、作業を進めてください。
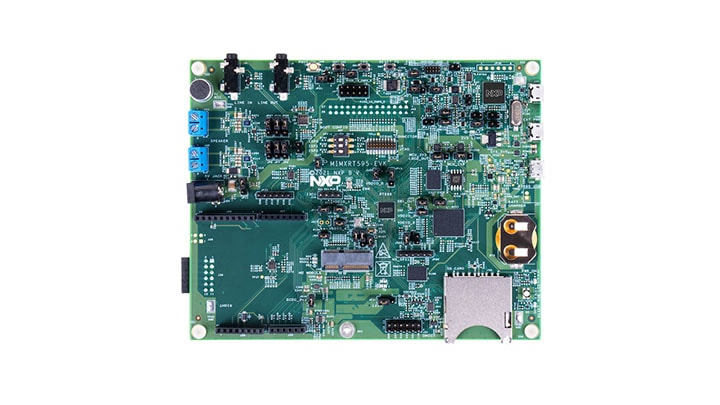
1.1 ボードの概要
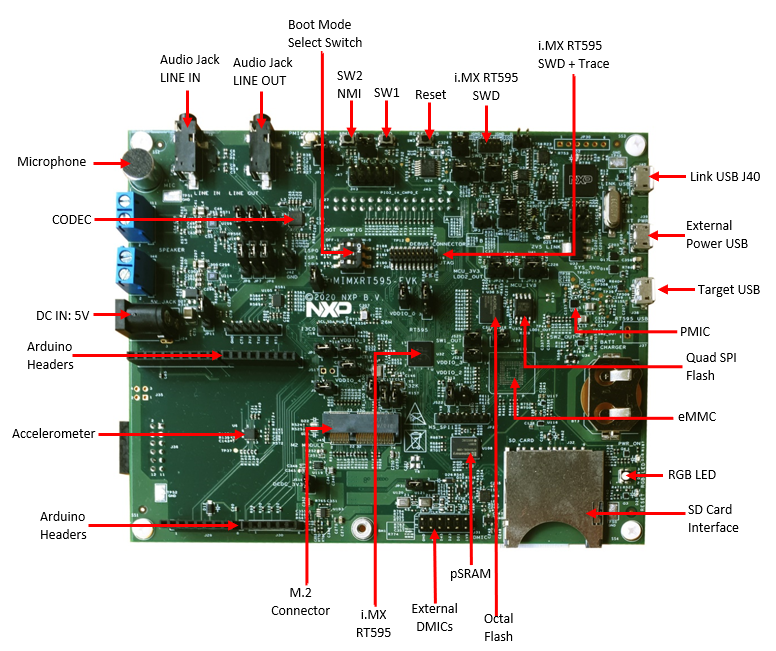
1.2 USBケーブルを接続する
ボードには3つのmicro-USBコネクタがあります。下の写真に示すように、USBケーブルを「Link USB (J40)」と表記されたコネクタに接続します。
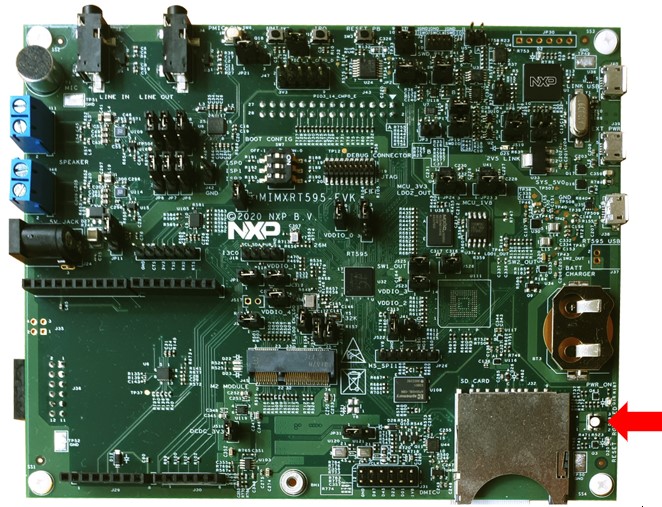
ボードの電源がオンになると、RGB LED D19が断続的に点滅します。

1.3 クイック・スタート・デモを実行する
MIMXRT595-EVKには、以下で説明する「LEDの点滅」デモのほか、Cortex M33、Fusion F1 DSP、およびGPUを実行するデモが搭載されています。このクイック・スタート・デモについては、アプリケーション・ノートに記載される予定です。
ボードの電源がオンになると、RGB LED D19が断続的に点滅します。
2. ソフトウェアの入手
2.1 MCUXpresso SDKですぐに設計を開始する
MCUXpressoソフトウェア開発キット (SDK) は無償で利用することができ、オープンソースのライセンスに基づいて、すべてのハードウェア抽象化およびペリフェラル・ドライバ・ソフトウェアのすべてのソース・コードが提供されます。
下のボタンをクリックして、MIMXRT595-EVK用に事前設定済みのSDKリリースをダウンロードしてください。スペースを含まないディレクトリ・パスにSDKを解凍します。

オンラインのSDK Builder にアクセスして、MIMXRT595-EVK用のカスタムSDKパッケージを作成することもできます。
2.2 ツールチェーンをインストールする
MCUXpressoソフトウェア開発キット (SDK) は無償で利用することができ、オープンソースのライセンスに基づいて、すべてのハードウェア抽象化およびペリフェラル・ドライバ・ソフトウェアのすべてのソース・コードが提供されます。
下のボタンをクリックして、MIMXRT595-EVK用に事前設定済みのSDKリリースをダウンロードしてください。スペースを含まないディレクトリ・パスにSDKを解凍します。
オンラインのSDK Builder にアクセスして、MIMXRT595-EVK用のカスタムSDKパッケージを作成することもできます。
NXPは、MCUXpresso IDEというツールチェーンを無償で提供しています。MCUXpresso v11.3.0以上をダウンロードしてください。

別のツールチェーンを使用したい場合は?
MCUXpresso SDKは、IAR 、Keil、コマンドラインGCC などの他のツールをサポートしています。

2.3 MCUXpresso Config Tools
MCUXpresso Config Toolsは、ユーザーがMCUXpresso SDKプロジェクトを新規に作成するための構成ツールの統合スイートであり、カスタム・ボード・サポート用の初期化Cコードを生成するためのピンとクロックのツールも備えています。MCUXpresso IDEの一部として完全に統合されていますが、別のツールチェーンを使用する場合は独立したツールとしてダウンロードすることもできます。i.MXRT595をサポートするには、MCUXpresso Config Tool v9.0以上が必要です。

2.4 LPCScrypt
デバッガおよび仮想COMポート用のドライバもインストールする必要があります。これらはLPCScryptパッケージの一部であり、以下からダウンロードできます。J-Linkインターフェースを使用するには、LPC-Link2の回路のファームウェアもアップデートする必要があります。これについては、以下のチュートリアルで説明しています。
2.5 シリアル・ターミナル
多くのMCUXpresso SDKサンプル・アプリケーションでは、MCU UART経由でデータを出力します。任意のターミナル・ソフトウェアをインストールし、115200のボーレート、8データ・ビット、パリティなし、1ストップ・ビットに設定します。MIMXRT595-EVKの仮想COMポートのポート番号を確認するには、デバイス・マネージャを開き、「Ports (COM and LPT)(ポート(COMとLPT))」グループでポートを探します。
ターミナル・アプリケーションの使用方法がわからない場合は、次のいずれかのチュートリアルをお試しください。
MCUXpressoターミナル、Tera Termチュートリアル、PuTTYチュートリアル2.6 J-Link
Fusion F1 DSPをデバッグするには、必須のJ-Linkドライバをダウンロードする必要があります。このソフトウェアをダウンロードしてインストールする方法については、次のチュートリアルに従ってください。
2.7 Xtensa Xplorer IDEおよびツールのインストール
MIMXRT595-EVKでDSPのコーディングおよびデバッグを行うには、Cadence Tensilica Xplorerをダウンロードする必要があります。これはMIMXRT595のDSPコアで利用可能な唯一の開発IDEです
3. ビルドと実行
3.1 MCUXpresso SDKサンプル・コードを確認する
MCUXpresso SDKには、サンプル・アプリケーション・コードが豊富に用意されています。利用可能なコードを確認するには、SDKをインストールしたフォルダの「SDKボード」フォルダを参照し、「MIMXRT595-EVK」を選択します。(
特定のサンプル・コードの詳細については、サンプルのディレクトリにあるreadme.txtファイルを開いてください。
3.2 MCUXpresso SDKサンプルのビルドとデバッグ
興味のあるデモ・アプリケーションやドライバのサンプルがいくつかあれば、それをビルドおよびデバッグする方法を知りたくなることでしょう。SDKのスタート・ガイドでは、SDKでサポートされているすべてのツールチェーンのデモを設定、ビルド、およびデバッグする方法について、わかりやすく手順に沿って解説しています。以下のガイドを参照し、MCUXpresso IDEでサンプル・アプリケーションを開いてビルドやデバッグを行う方法を習得してください。
MCUXpresso IDEを使用する
DSPデモのビルドと実行
RT500 SDKには、サンプルのDSPアプリケーションが豊富に用意されています。各DSPサンプルに、Arm CM33用とDSP Fusion F1用の2つのソース・ディレクトリが含まれます。
DSPデモをデバッグするには、次の2つの手順に従う必要があります。1つ目は、MIMXRT595-EVKにCM33アプリケーションのビルドと書き込みを行うことです。2つ目は、Xtensa Xplorer IDEを使用してDSPアプリケーションのビルドとデバッグを行うことです。
Cortex-M33アプリケーションのビルドとフラッシュ
次の手順では、Cortex-M33アプリケーション向けにMCUXpresso IDEを使用したmu_pollingアプリケーションについて説明します。MCUXpresso IDEのインストールについては、このスタート・ガイドのセクション「2. ソフトウェアの入手」に記載されています。
- MCUXpresso IDEを開きます。
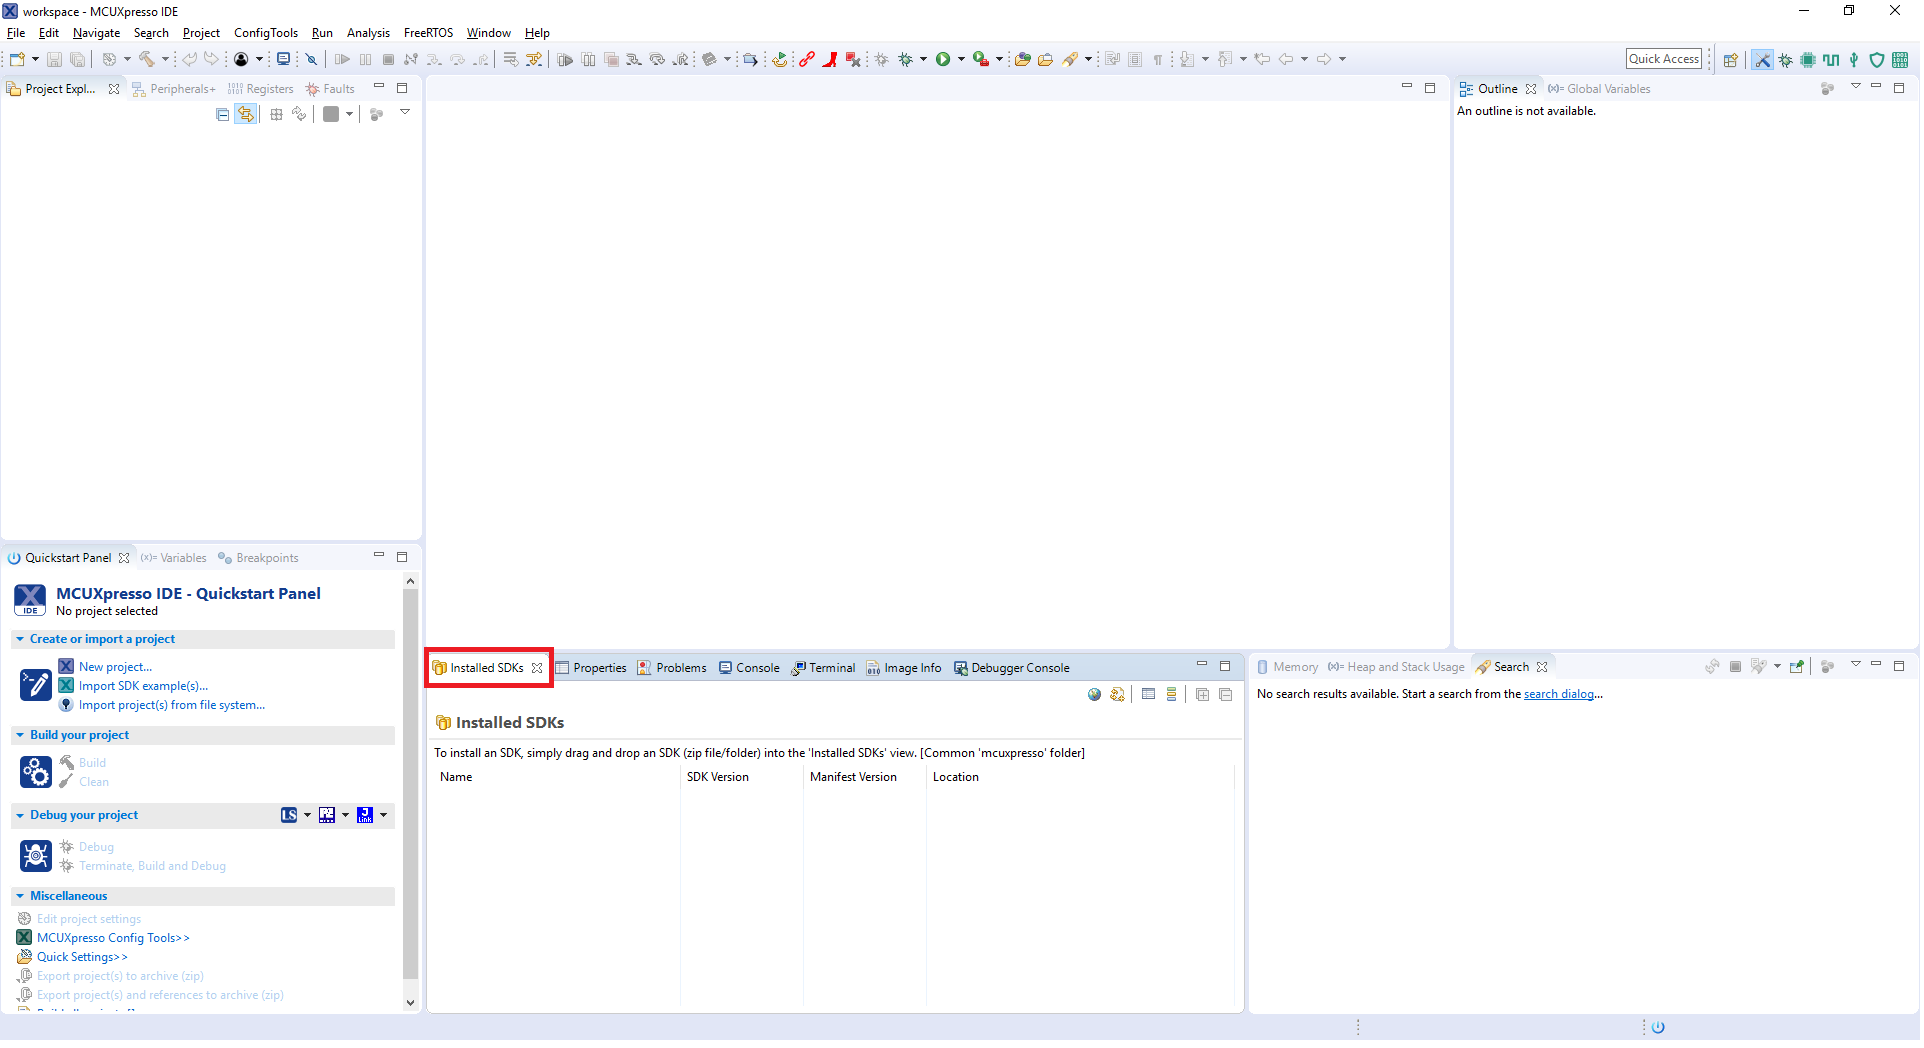
- MCUXpresso IDEウィンドウ内のビューを[Installed SDKs(インストール済みSDK)]に切り替えます。
- MIMXRT595-EVK SDKのzipファイルを[Installed SDKs(インストール済みSDK)]ビューにドラッグ&ドロップします。
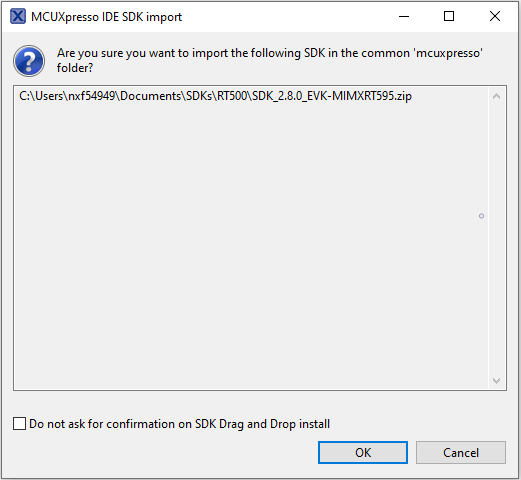
- 次のポップアップが表示されます。[OK]をクリックしてインポートを続行します。
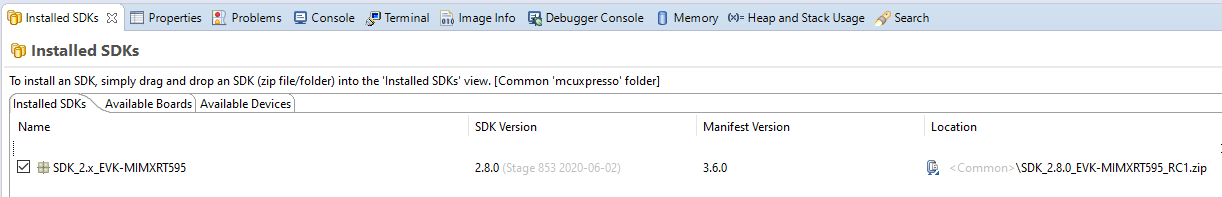
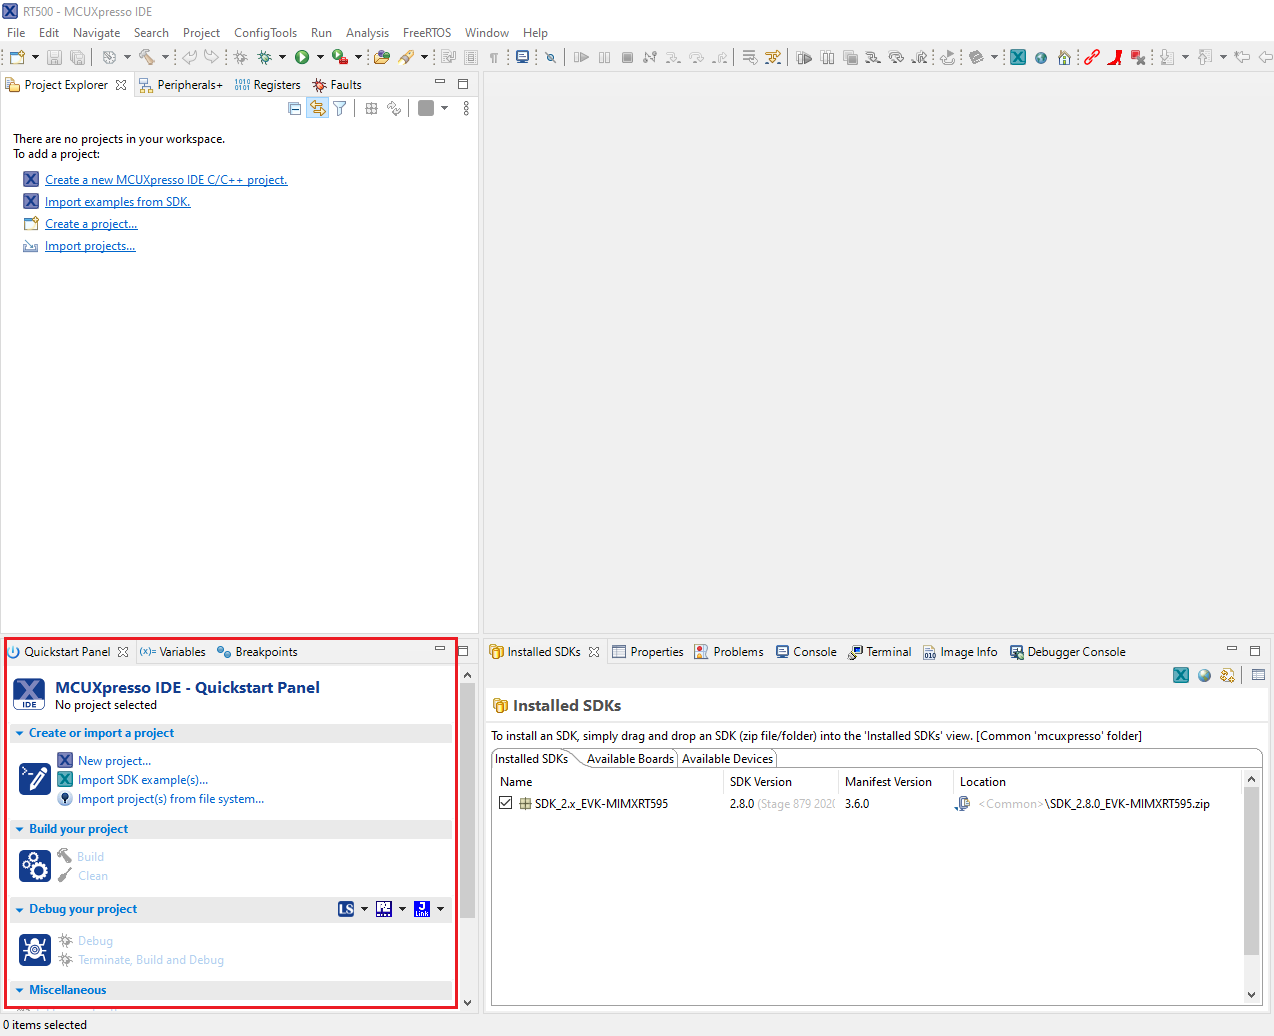
- インストールされたSDKは、以下に示すように[Installed SDKs(インストール済みSDK)]ビューに表示されます。
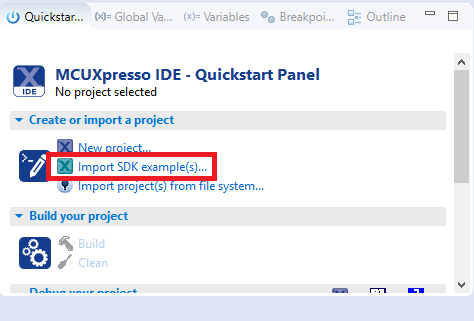
- 左下隅にある「Quickstart Panel(クイックスタート・パネル)」を確認します。
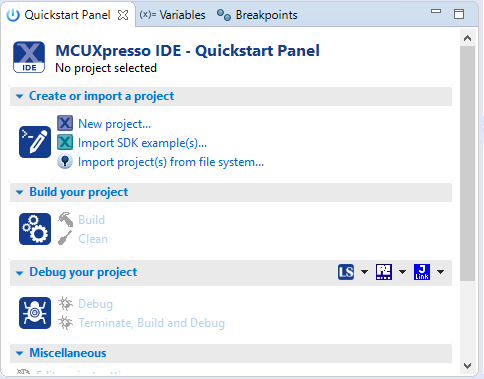
- その中の[Import SDK example(s)...(SDKサンプルのインポート)]をクリックします。

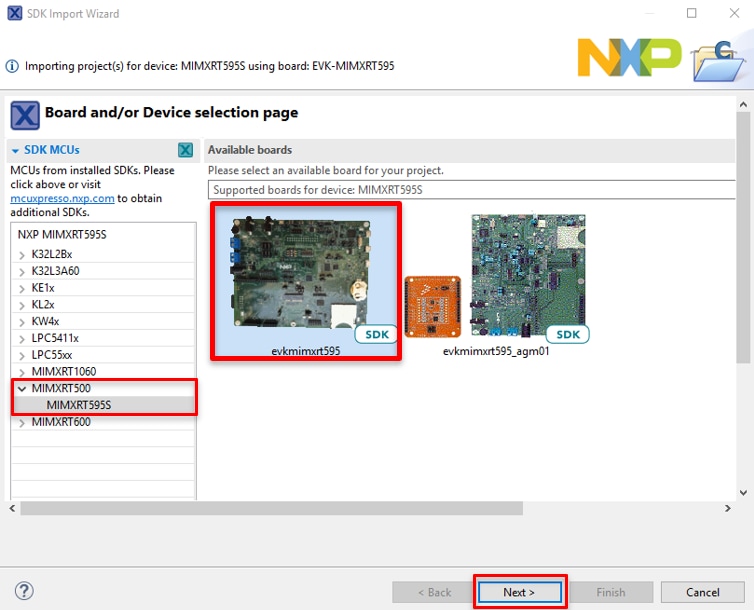
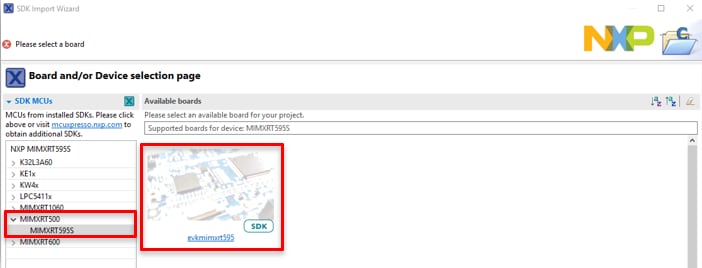
- サンプルをインポートして実行させるボードとして「evkmimxrt595ボード」をクリックして選択し、[Next(次へ)]をクリックします。
- 矢印ボタンを使用して[
dsp_examples]カテゴリを展開し、dsp_mu_polling_cm33の横にあるチェックボックスをクリックしてそのプロジェクトを選択します。出力用にデフォルトのセミホスティングではなくUARTを使用するには、[Project Options(プロジェクト・オプション)]にある[SDK Debug Console(SDKデバッグ・コンソール)]のチェック・ボックスで[UART]を選択します。その後、[Finish(完了)]をクリックします。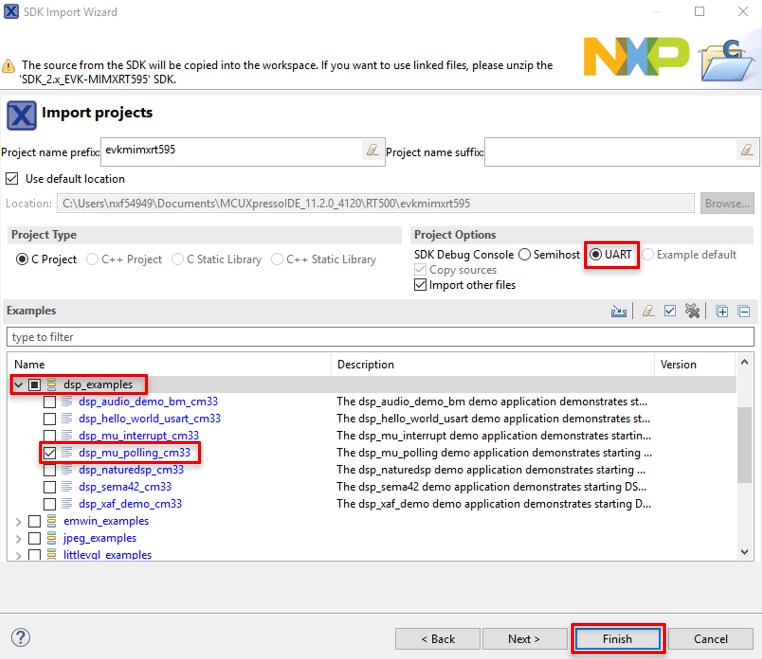
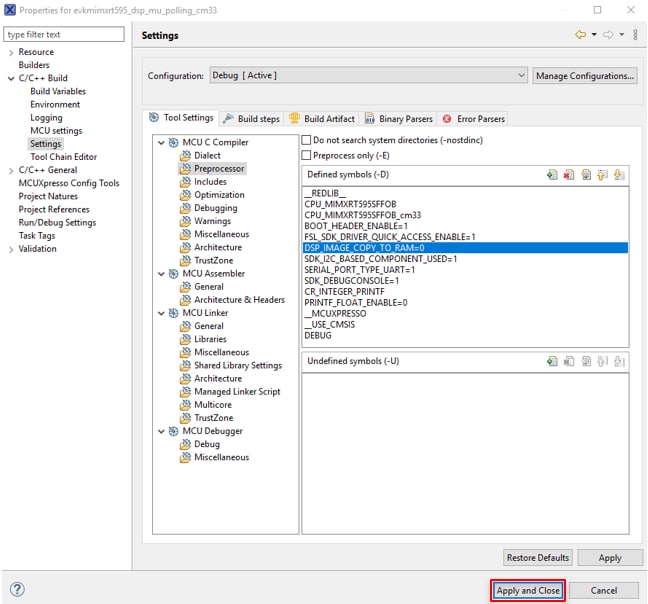
DSP_ IMAGE_COPY_TO_RAMマクロの値を確認します。これを行うには、プロジェクトを右クリックしてプロジェクトの[Properties(プロパティ)]に移動します。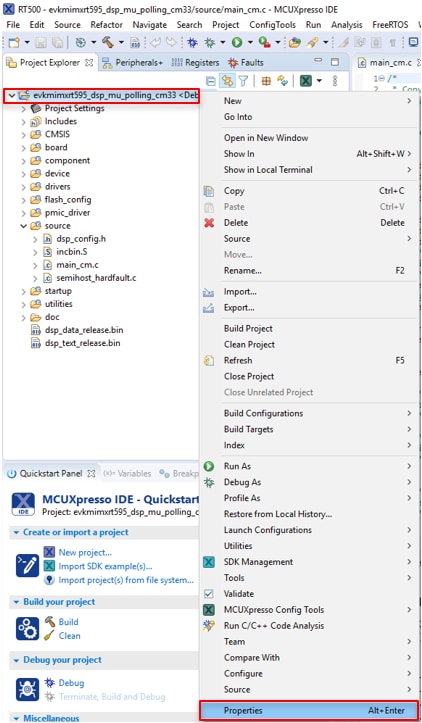
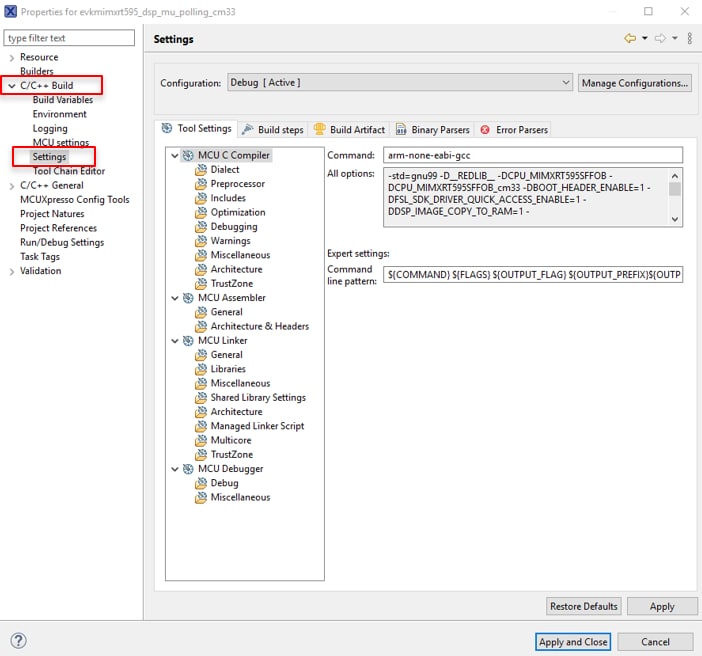
- [C/C++ Build(C/C++のビルド)]オプションを開き、 [Settings(設定)]を選択します。
- [Tool Settings(ツール設定)]にある「Preprocessor(プリプロセッサ)」フォルダを選択し、
DSP_COPY_IMAGE_TO_RAMの値を0に変更します。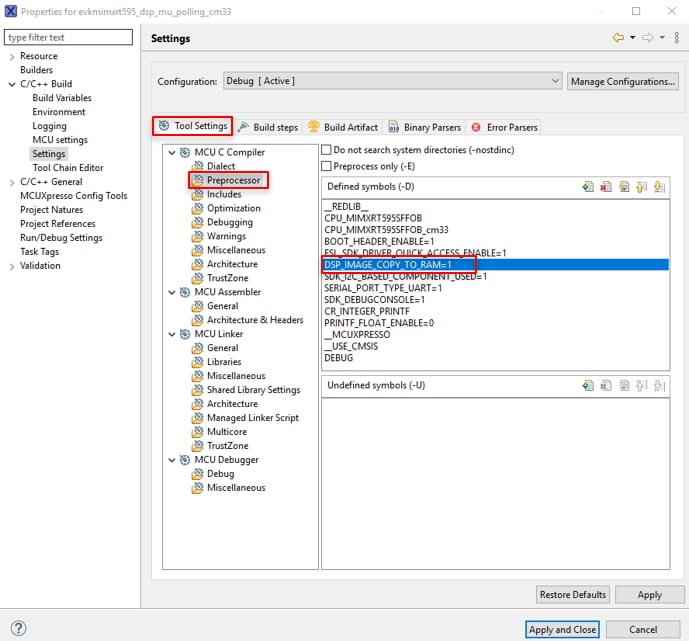
- [Apply and Close(適用して閉じる)]をクリックします。
- プロジェクトを選択し、ビルドします。
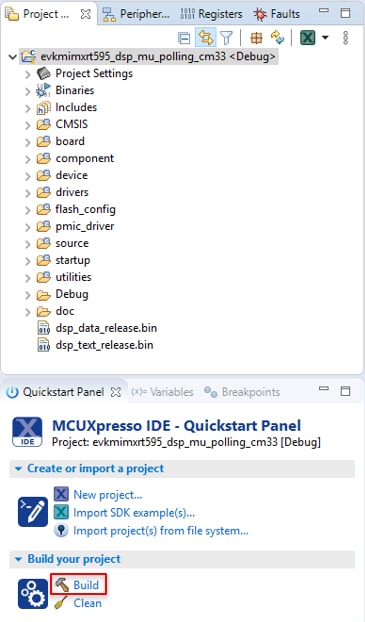
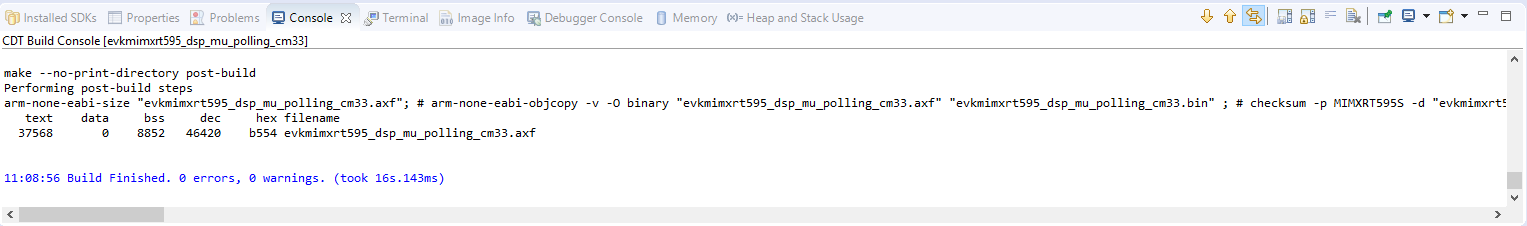
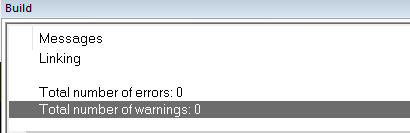
- プロジェクトが問題なくビルドされます。
- micro USBをJ40「LINK USB」ポートに挿入し、ボードをコンピュータに接続します。

- アプリケーションをMIMXRT595-EVKにダウンロードします。
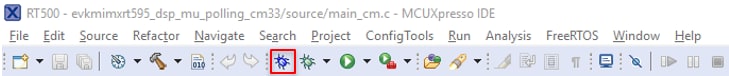
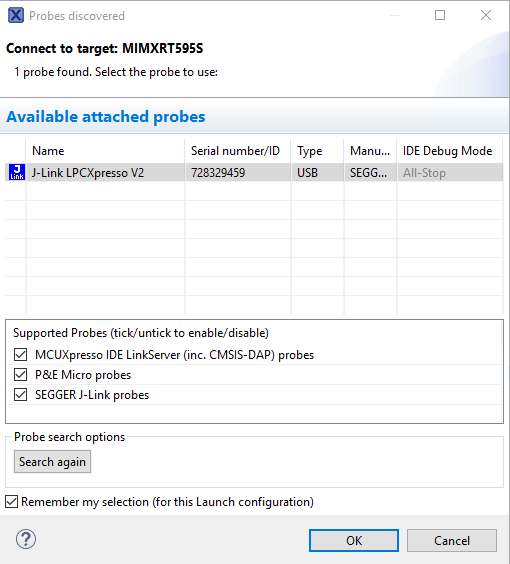
- J-Linkデバッグ・プローブを選択します。
- アプリケーションを実行します。
DSPアプリケーションのビルドとデバッグ
次の手順では、DSP向けにXtensa Xplorer IDEを使用したmu_pollingアプリケーションについて説明します。Xtensa Xplorer IDEのインストールについては、このスタート・ガイドのセクション「2. ソフトウェアの入手」に記載されています。
- Xtensa Xplorer IDEを開きます。
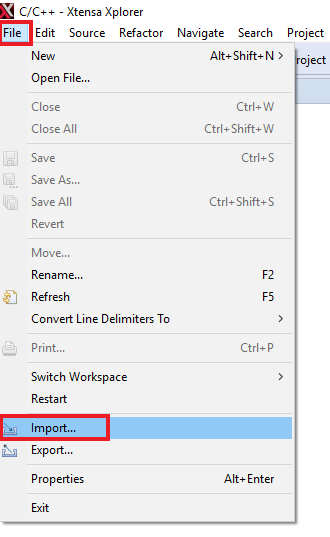
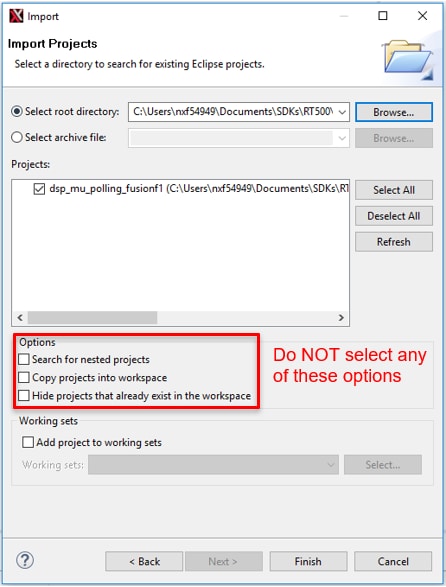
- 「mu_polling」デモをワークスペースにインポートします。[File(ファイル)]>[Import(インポート)]の順に選択します
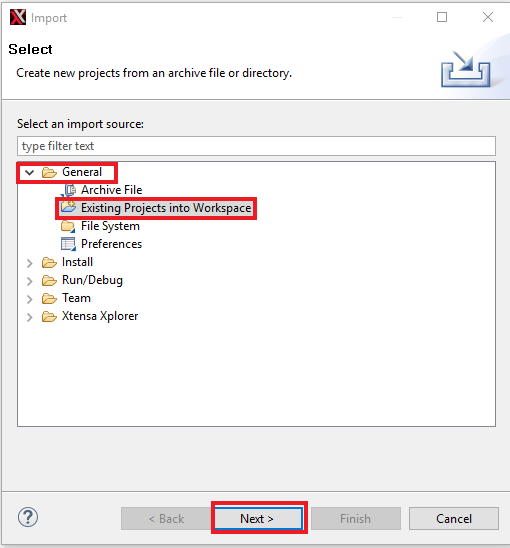
- [Existing Projects into Workspace(既存のプロジェクトをワークスペースへ)]を選択します。
- [Browse(参照)]ボタンを使用し、SDKの「mu_polling dsp demo」を選択します。パス名にスペースが含まれていないことを確認してください。
パスは次のとおりです。「\boards\evkmimxrt595\dsp_examples\mu_polling\dsp」 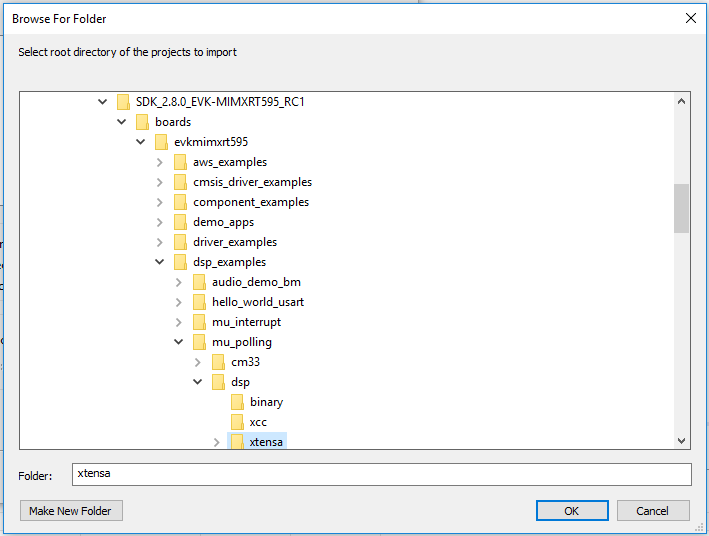
- インポートが完了すると、プロジェクト・エクスプローラに「
dsp_mu_polling_fusionf1」が表示されます。このプロジェクトには、DSPのコードが含まれています。main関数は[source(ソース)]>[main_dsp.c]で確認できます。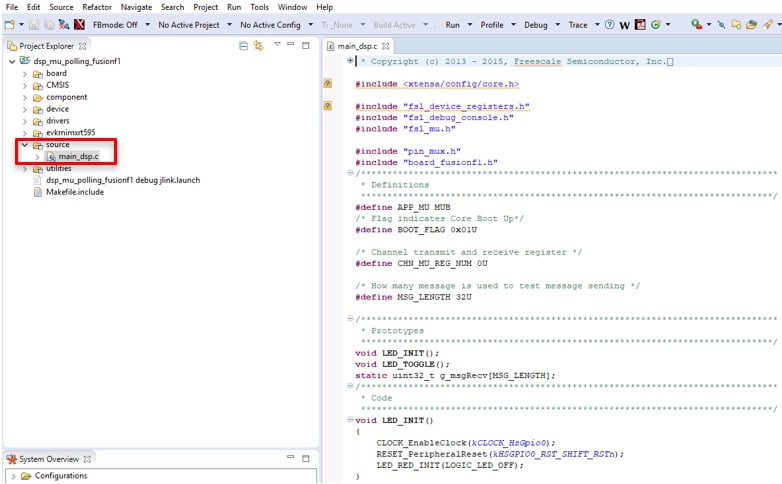
- DSPアプリケーションをビルドするには、次の構成を設定する必要があります(メニュー・バーのドロップダウン・ボタンを使用します)。

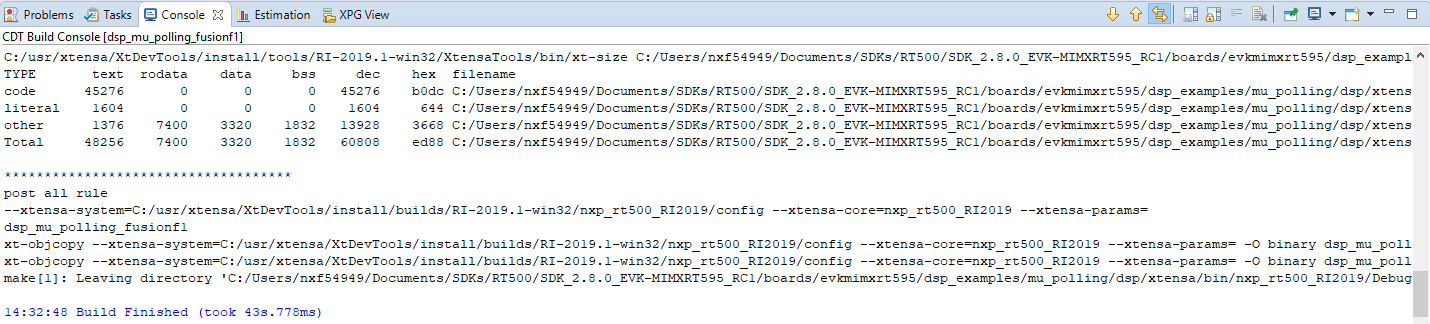
- [Build Active(アクティブをビルド)]ボタンをクリックしてアプリケーションをビルドします
- ビルドは正常に完了するはずです。エラーが発生した場合は、SDKのディレクトリ・パスにスペースが含まれていないことを確認してください。
-
「C:\Program Files (x86)\Tensilica\Xtensa OCD Daemon 14.01」でコマンド・プロンプトを開き、「xt-ocd.exe -c topology.xml」コマンドを実行します。次のように表示されます。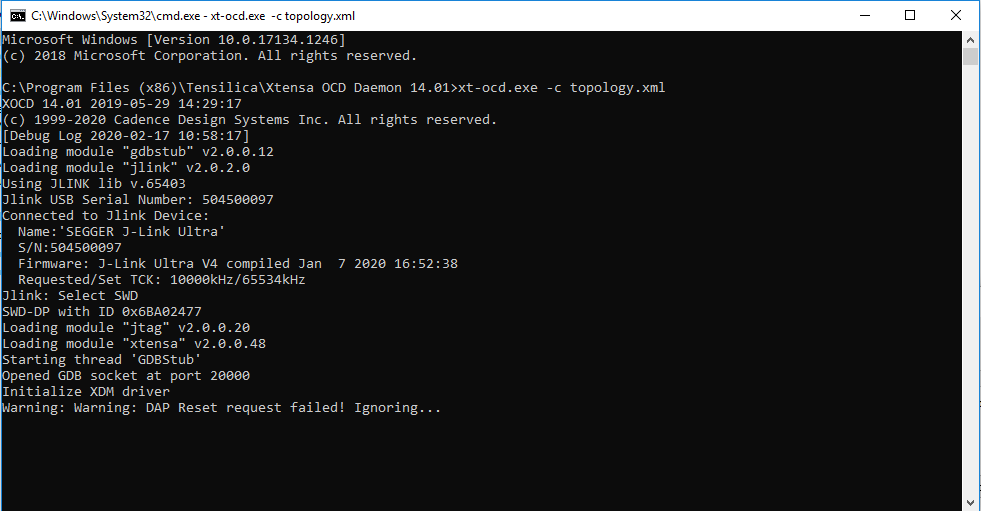
- PCのターミナル・アプリケーション(PuTTY、Tera Termなど)を開き、事前に確認したデバッグCOMポートに接続します。次の設定値を用いてターミナルを設定します。
- ボーレート115200
- パリティなし
- 8データ・ビット
- 1ストップ・ビット
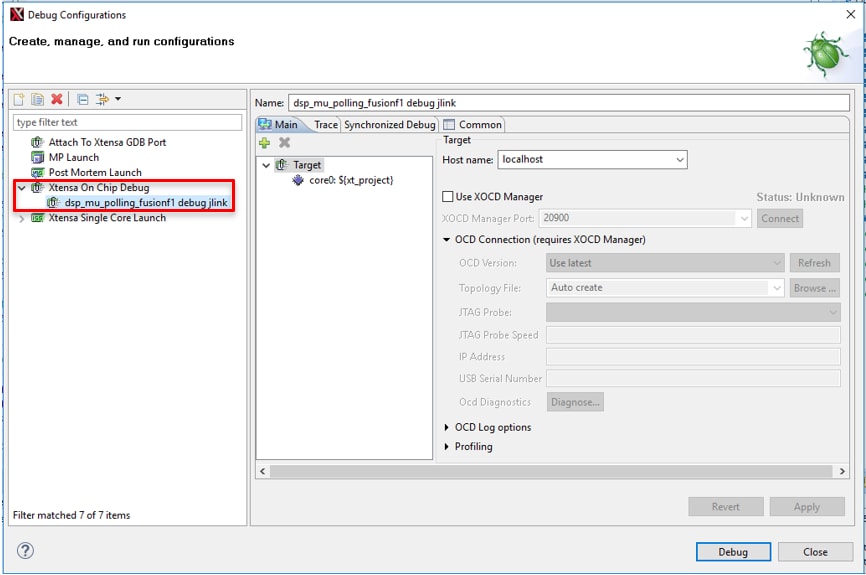
- Xtensa Xplorer IDEに移動し、[Debug(デバッグ)]の動作設定ボタンを使用して、[Debug Configuration(デバッグの構成)]を開きます。
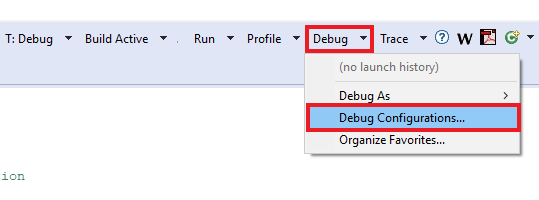
- 「dsp_mu_polling Xtensa On Chip Debug」を選択してください。その後、[Debug(デバッグ)]をクリックします。
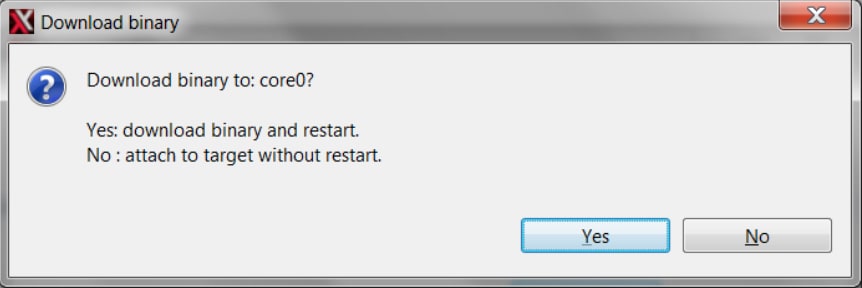
- 新しいウィンドウが開き、アプリケーションをコア0にダウンロードするかどうかの確認メッセージが表示されます。[Yes(はい)]をクリックします。
- Xtensa Xplorerがデバッグ画面に切り替わります。
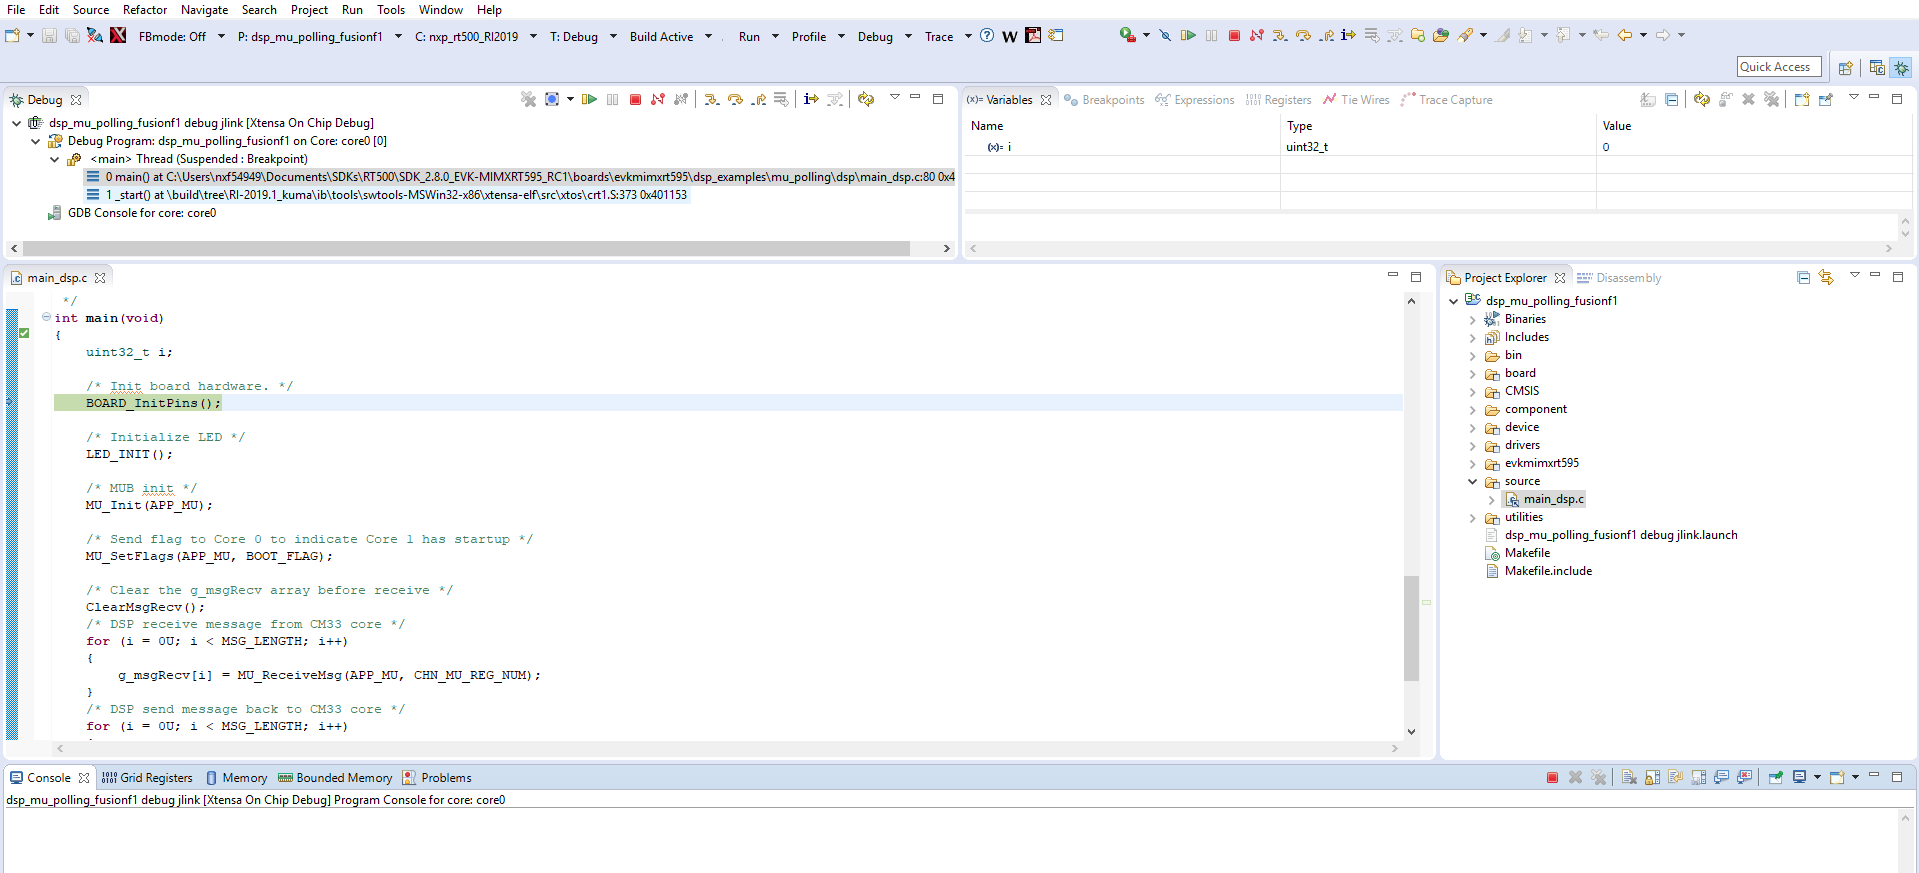
- [Resume(再開)]ボタンをクリックしてプロジェクトを開始します。
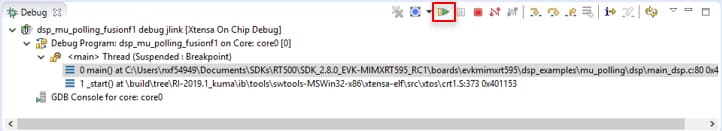
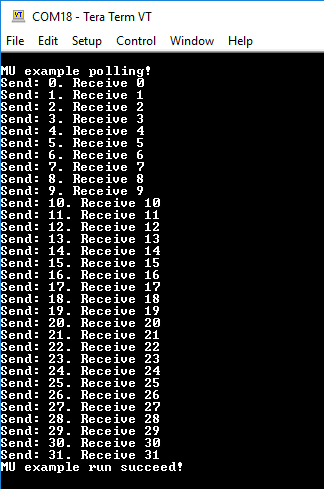
- RGB LED D19が赤色に点滅し、ターミナルで以下のように表示されます。
- Xtensa Xplorer IDEでのデバッグ・セッションを停止するには、[Terminate(終了)]ボタンをクリックします。
- CM33アプリケーションを実行しているMCUXpresso IDEのデバッガを停止します。
IAR EWARMを使用する
サンプル・アプリケーションのビルド
次の手順に従ってmu_pollingアプリケーションを開きます。このアプリケーションのコードは、Cortex M33コアとDSPコアの両方に対応します。以下の手順では、Cortex M33コアのコンパイルとデバッグの手順を取り上げています。
DSPコードのコンパイルとデバッグの手順については、「MCUXpresso IDEを使用する」チュートリアルのセクション2に記載されています。他のサンプル・アプリケーションでは、手順がわずかに異なる場合があります。アプリケーションによってはパスのフォルダ階層が深くなるためです。
IAR Embedded Workbench for Arm 8.50.9以上を使用してください。
- 最初に、以前にダウンロードしたRT500 SDKパッケージを解凍します。
- 目的のサンプル・アプリケーション・ワークスペースを開きます。ほとんどのサンプル・アプリケーション・ワークスペースのファイルは、次のパスに置かれています。
/boards/ / / /iar mu_pollingデモをサンプルとして使用する場合、パスは次のようになります。
/boards/evkmimxrt595/dsp_examples/mu_polling/cm33/iar - ドロップダウン・リストから、目的のビルド・ターゲットを選択します。ここでは、「
dsp_mu_polling_cm33 - debug」ターゲットを選択します。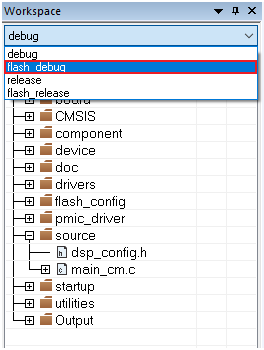
DSP_IMAGE_COPY_TO_RAMマクロの値を0に変更します。プロジェクトを右クリックして[Options(オプション)]を選択し、プロジェクトのプロパティを開きます。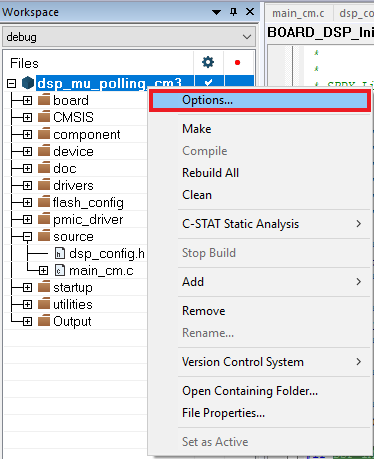
- [C/C++ Compiler(C/C++コンパイラ)]をクリックし、[Preprocessor(プリプロセッサ)]を選択します。
DSP_IMAGE_COPY_TO_RAMを0に変更します。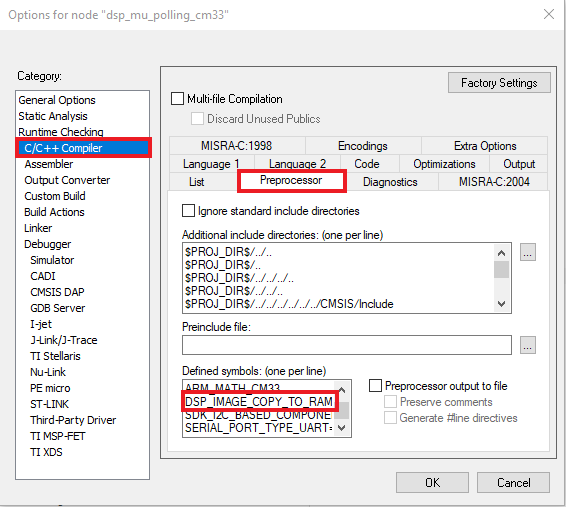
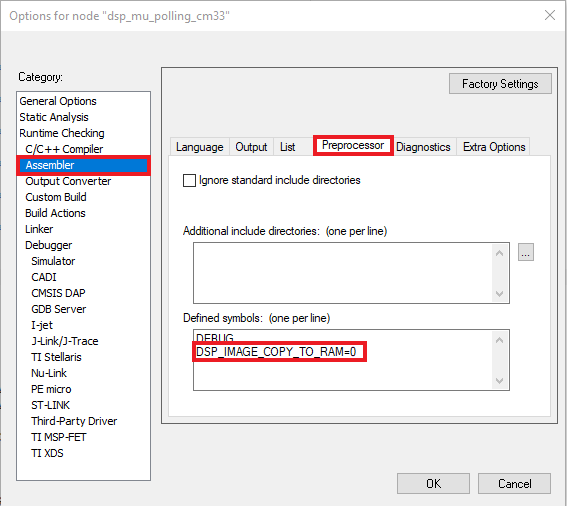
- [Assembler(アセンブラ)]に移動し、[Preprocessor(プリプロセッサ)]オプションを選択して、同じマクロを変更します。
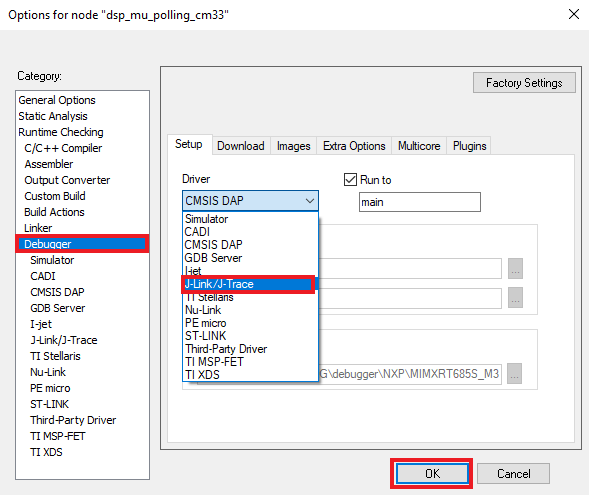
- [Debugger(デバッガ)]セクションに移動し、デバッガ・ドライバを「Jlink」に変更します。[OK]ボタンをクリックします。
- アプリケーションをビルドするには、下の図で赤色でハイライト表示されている[Make(作成)]ボタンをクリックします。
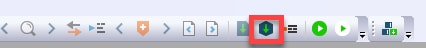 >
> - ビルドが正常に完了します。
サンプル・アプリケーションの実行
ボードのLPC-Link2回路は、スタート・ガイド・ウェブサイトのステップ2.4「LPCScrypt」で、J-Linkインターフェースを使用するようにアップデートされている必要があります。まだアップデートしていない場合には、J-Linkインターフェースを使用するようにボードのデバッグ・ファームウェアをLPCScryptでアップデートする方法について、スタート・ガイド・ウェブサイトの該当セクションを参照してください。
-
- USBケーブルを使用して、PCを開発プラットフォームのJ40「Link USB」に接続します。ボードの電源投入時にDFULinkジャンパ (
JP1) が取り外されていることを確認してください。
- [Download and Debug(ダウンロードとデバッグ)]ボタンをクリックして、アプリケーションをターゲットにダウンロードします。

- アプリケーションがターゲットにダウンロードされると、自動的にmain()関数まで実行されます。
- [Go(実行)]ボタンをクリックすると、コードが実行され、アプリケーションが開始されます。

- Cortex-M33で
mu_polling_cm33アプリケーションが実行されています。
- USBケーブルを使用して、PCを開発プラットフォームのJ40「Link USB」に接続します。ボードの電源投入時にDFULinkジャンパ (
- DSPアプリケーションのビルドとデバッグ
このアプリケーションのDSP部分のコードのビルドやデバッグを行うには、「MCUXpresso IDEを使用する」チュートリアルを開き、「2. DSPアプリケーションのビルド」以降の手順に従います。
Arm GCCを使用する
ツールチェーンのセットアップ
ここでは、Arm GCCツールチェーンを使用してKSDKデモ・アプリケーションのビルドと実行を行う際に必要となるコンポーネントをインストールする手順について説明します。この手順はMCUXpresso SDKでサポートされているものです。Arm GCCツールの使用方法はさまざまですが、今回の例では、Windows環境に焦点を当てています。ここでは省略しますが、GCCツールは、Linux OSやMac OS Xの環境でも利用できます。
GCC Arm Embeddedバージョン9-2020-q2を使用してください。
GNU-RM Arm Embeddedツールチェーンのインストール
GNU Arm Embeddedツールチェーンのダウンロード からインストーラをダウンロードして、実行します。これはGNU Arm Embeddedツールチェーン(コンパイラ、リンカなど)であり、GNUコンパイラ (GCC) が含まれています。
MinGWのインストール
MinGW (Minimalist GNU for Windows) 開発ツールは、サード・パーティ製のCランタイムDLL(Cygwinなど)に依存しないツール・セットを提供します。KSDKで使用されているビルド環境ではMinGWビルド・ツールを利用せず、MinGWとMSYSのベース・インストールを活用しています。MSYSは、Unix系のインターフェースと各種ツールを備えた基本シェルを提供します。
- MinGW - Minimalist GNU for Windowsファイル から最新のMinGW mingw-get-setupインストーラをダウンロードしてください。
- インストーラを実行します。インストール・パスとしては「C:\MinGW」を推奨しますが、他のどの場所にでもインストールできます。
- [Basic Setup(基本セットアップ)]で「
mingw32-base」と「msys-base」が選択されていることを確認します。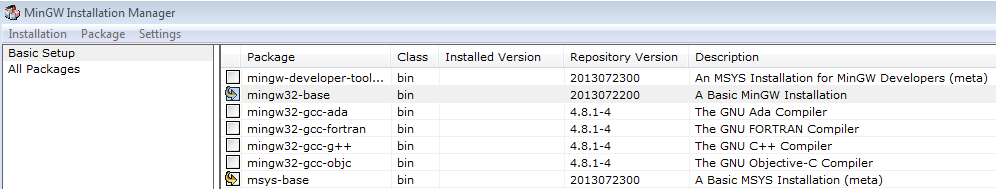
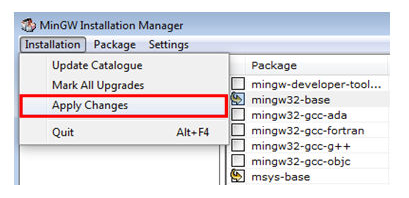
- [Installation(インストール)]メニューで[Apply Changes(変更を適用)]をクリックし、残りの手順に従ってインストールを完了します。
- Windows OSのPath環境変数に適切なアイテムを追加します。これは、[Control Panel(コントロール・パネル)]>[System(システム)]>[Advanced System Settings(システムの詳細設定)]の[Environment Variables...(環境変数)]セクションで設定します。パスは
\bin デフォルトのインストール・パスである
C:\MinGWを使用した例を以下に示します。パスが正しく設定されていないと、ツールチェーンは機能しません。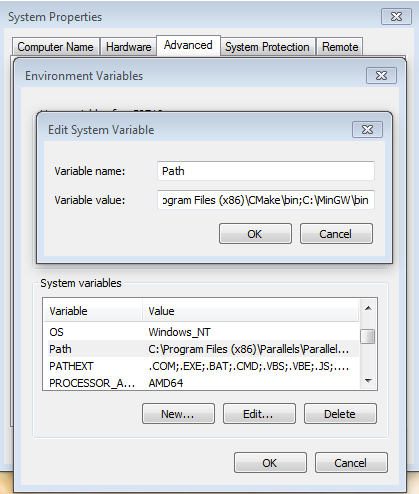
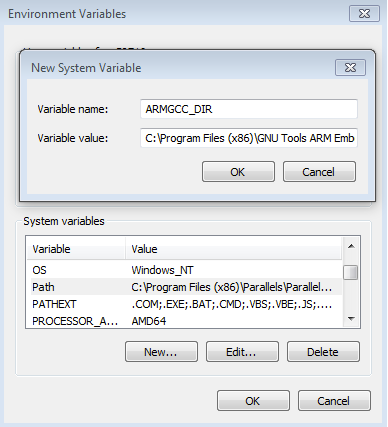
ARMGCC_DIR向けの新しい環境変数を追加する
新しいシステム環境変数を作成して、「ARMGCC_DIR」という名前を付けます。この変数の値で、ARM GCC Embeddedツールチェーンのインストール・パスを指定します。今回の例では、次のようになります。
C:\Program Files (x86)\GNU Tools ARM Embedded\
インストール・フォルダの正確なパス名については、GNU ARM GCC Embeddedツールのインストール・フォルダを参照してください。
CMakeのインストール
- CMakeの最新バージョンをCMakeからダウンロードします。
- CMakeをインストールします。インストール時には、必ず[Add CMake to system PATH(CMakeをシステムPATHに追加)]オプションを選択します。すべてのユーザーが使用できるパスにインストールするか、現在のユーザーのみが使用できるパスにインストールするかは、ユーザーが選択します。今回の例では、すべてのユーザーに対してインストールしています。
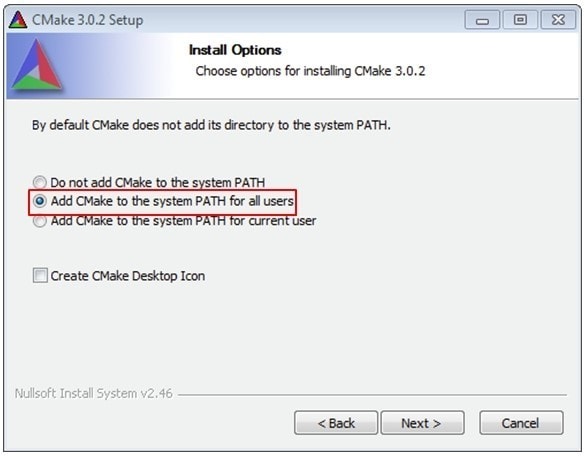
- インストーラの残りの手順に従います。
- PATHの変更を適用するには、システムの再起動が必要になる場合があります。
サンプル・アプリケーションのビルド
サンプル・アプリケーションをビルドする手順は次のとおりです。
- ファイル・エクスプローラで「
\boards\evkmimxrt595\dsp_examples\mu_polling\cm33\armgcc」ディレクトリを開き、「flags.cmake」ファイルを開きます。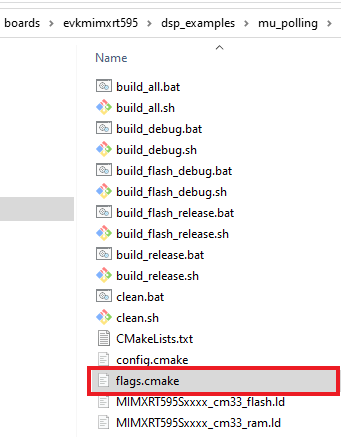
- 次の各セクションを編集し、
DDSP_IMAGE_COPY_TO_RAMの値を0に変更します。CMAKE_ASM_FLAGS_DEBUG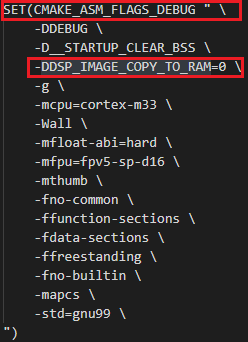
CMAKE_C_FLAGS_DEBUG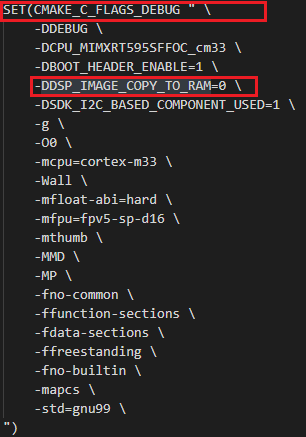
- GCC ARM Embeddedツールチェーンのコマンド・ウィンドウが開いていない場合はここで開きます。ウィンドウを開くには、Windows OSの[スタート]メニューから、[プログラム]>[GNU Tools Arm Embedded
]に移動して、[GCC Command Prompt(GCCコマンド・プロンプト)]を選択します。 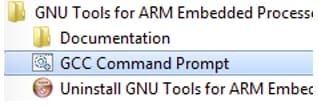
- サンプル・アプリケーションのプロジェクト・ディレクトリに移動します。パスは次のようになります。
/boards/ / / /armgcc このガイドの場合、実際のパスは次のようになります。
/boards/evkmimxrt685/dsp_examples/mu_polling/cm33/armgcc - コマンドラインで「
build_debug.bat」と入力するか、Windows OSのエクスプローラで「build_debug.bat」ファイルをダブルクリックして、ビルドを実行します。次のような出力画面が表示されます。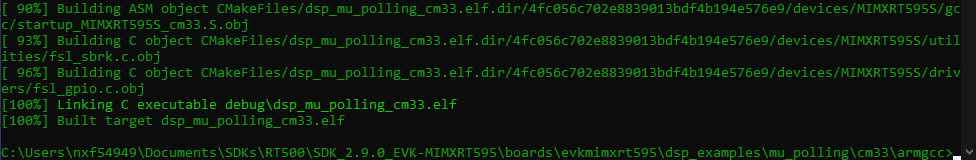
完了すると、プロジェクト・ディレクトリの「debug」という名前のフォルダ内に
.elfファイルが作成されます。
サンプル・アプリケーションの実行
GCCツールを使用するには、J-Linkデバッグ・インターフェースが必要となります。ボードのOpenSDAファームウェアを最新のJ-Linkアプリケーションにアップデートするには、OpenSDAにアクセスしてください。J-Link OpenSDAアプリケーションをインストールしたら、SeggerからJ-Linkドライバとソフトウェア・パッケージをダウンロードします。
- USBケーブルを使用して、PCを開発プラットフォームの
J40「Link USB」に接続します。ボードの電源投入時にDFULinkジャンパ (JP1) が取り外されていることを確認してください。
- J-Link GDBサーバ・アプリケーションを開きます。J-Linkソフトウェアがインストールされている場合、「
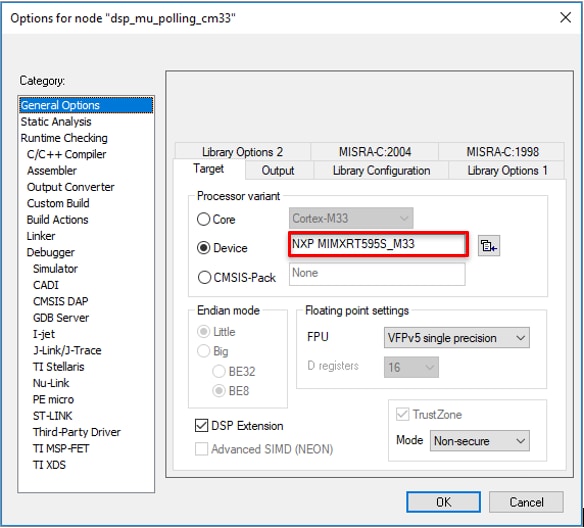
C:\Program Files (x86)\SEGGER\ J-Link」によりアプリケーションを起動できます。\ J-Link GDB Server - この例で選択するターゲット・デバイスを「MIMXRT595S_M33」に、使用するインターフェースをSWDに変更します。
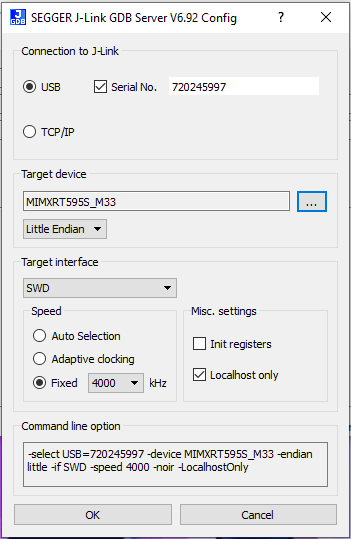
*お使いのデバイスではシリアル番号が異なる場合があります。デバイスのシリアル番号は、(お使いのMIMXRT595が
J40で接続済みの状態で)Jlink.exeを開くと確認できます。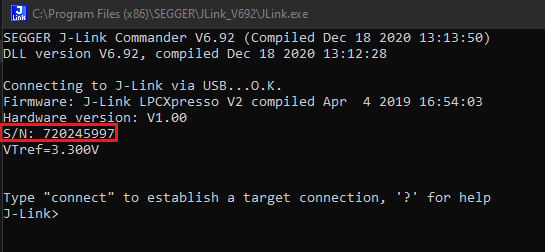
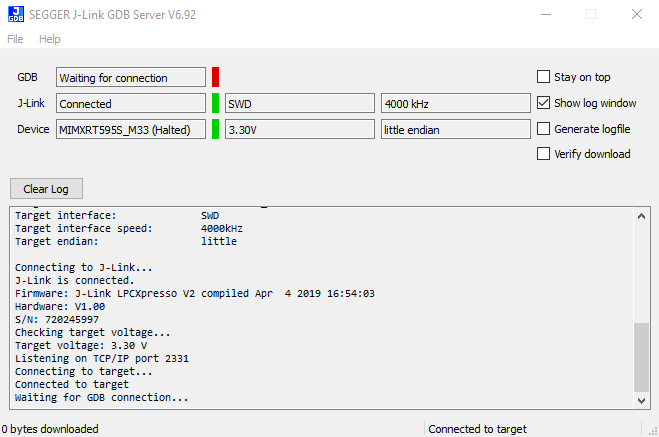
- 接続すると、画面は次の図のようになります。
- GCC ARM Embeddedツールチェーンのコマンド・ウィンドウが開いていない場合はここで開きます。ウィンドウを開くには、Windows OSの[スタート]メニューから、[プログラム]>[GNU Tools Arm Embedded
]に移動して、[GCC Command Prompt(GCCコマンド・プロンプト)]を選択します。 - デモ・アプリケーションの出力を格納するディレクトリに変更します。出力は、選択したビルド・ターゲットに応じて、次のいずれかのパスに格納されます。
/boards/ / / /armgcc/debug /boards/ / / /armgcc/release このガイドの場合、パスは次のようになります。
/boards/evkmimxrt595\dsp_examples\mu_polling\cm33\armgcc\debug - 「
arm-none-eabi-gdb.exe」というコマンドを実行します。この例の場合、「.elf arm-none-eabi-gdb.exe dsp_mu_polling_cm33.elf」というコマンドになります。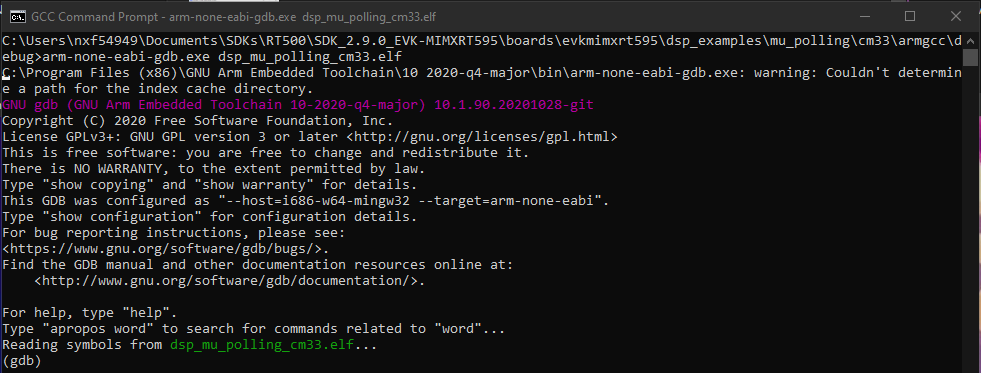
- 次のgdbコマンドを実行します。
- 「target remote localhost:2331」
- 「load」
- 「monitor reset」
- 「monitor go」コマンドを実行すると、サンプル・アプリケーションが開始されます。
mu_polling_cm33アプリケーションが実行されています。
DSPアプリケーションのビルド
DSPアプリケーションのビルドやデバッグを行うには、同じセクションにあるMCUXpressoチュートリアルの「2. DSPアプリケーションのビルド」の章の手順に従います。
SDKサンプルの変更
4.1 MCUXpresso SDKからのサンプル・プロジェクトのクローンを作成する
オプションA:MCUXpresso IDEを使用して、サンプル・プロジェクトのクローンを作成します。
MCUXpresso IDEを使用する
サンプル・アプリケーションのビルド
次の手順では、汎用出力の操作方法について説明します。このサンプルでは、PWM信号を生成してLEDの輝度を変更するためのSCTimerを設定します。
- 左下隅にある「Quickstart Panel(クイックスタート・パネル)」を確認します
- その中の[Import SDK example(s)...(SDKサンプルのインポート)]をクリックします。
- サンプルをインポートして実行させるボードとして「evkmimxrt595ボード」をクリックして選択し、[Next(次へ)]をクリックします。
- 矢印ボタンを使用して
driver_examplesカテゴリを展開し、次にsctimerサンプルを展開したら、sctimer_pwm_with_dutycycle_changeの横にあるチェックボックスをクリックしてサンプルを選択します。出力用にデフォルトのセミホスティングではなくUARTを使用するには、[Project Options(プロジェクト・オプション)]にある[SDK Debug Console(SDKデバッグ・コンソール)]のチェック・ボックスで[UART]を選択します。[Finish(完了)]をクリックします。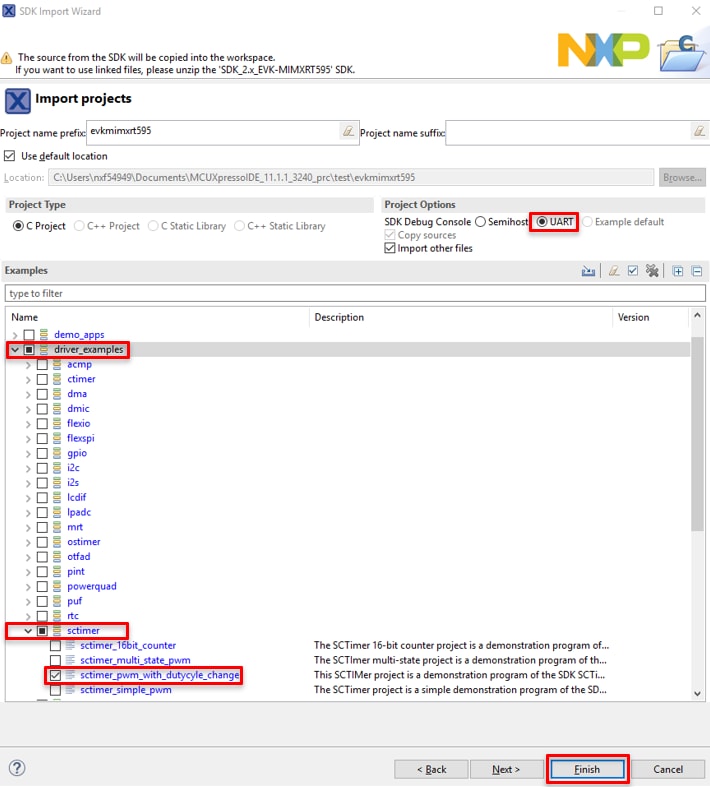
- [Project Explorer(プロジェクト・エクスプローラ)]ビューで「
evkmimxrt595_sctimer_pwm_with_duty_cycle_change」プロジェクトをクリックし、前述のようにデモをビルド、コンパイル、および実行します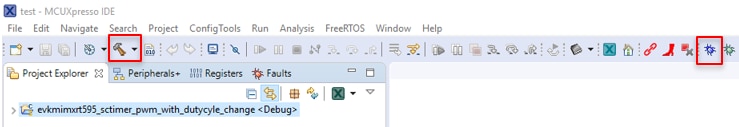
- 赤色LEDの輝度が変化します。
- デバッグ・セッションを終了します
オプションB:MCUXpresso Config Toolを使用して、サード・パーティ製IDEで使用するために既存のMCUXpresso SDKのサンプルのクローンを作成します。MCUXpresso Config Tool v9.0以上を使用してください。
MCUXpresso Config Toolを使用する
次の手順では、汎用出力の操作方法について説明します。このサンプルでは、PWM信号を生成してLEDの輝度を変更するためのSCTimerを設定します。
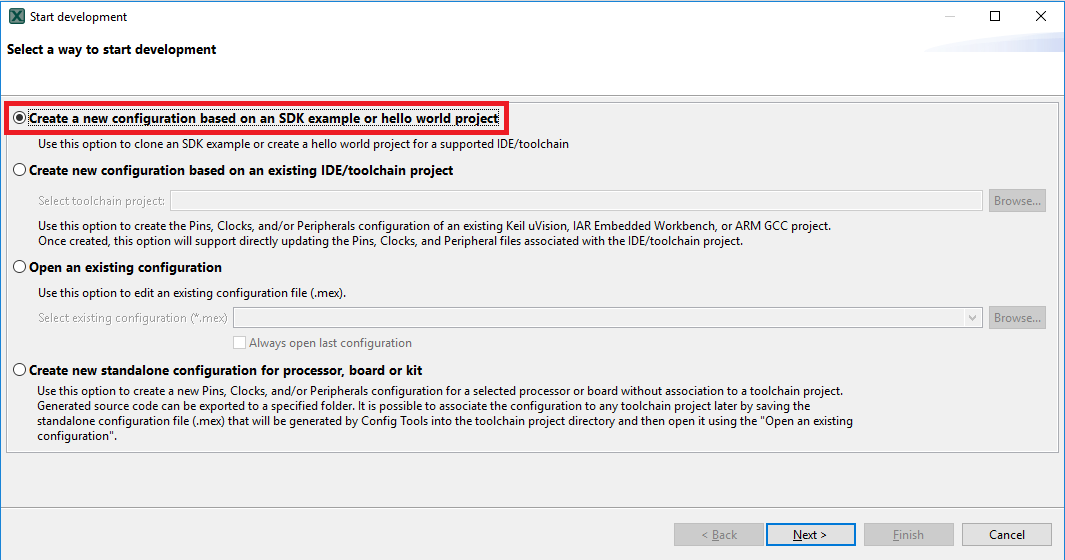
- MCUXpresso Config Toolsを開きます
- 表示されるウィザードで、[Create a new configuration based on an SDK example or hello world project(SDKサンプルまたはhello worldプロジェクトに基づいて構成を新規作成する)]ラジオ・ボタンを選択し、[Next(次へ)]をクリックします。
- 次の画面で、前に解凍したMCUXpresso SDKの場所を選択します。次に、使用中のIDEを選択します。SDKのビルド時にオンラインのSDKビルダで選択されたIDEのみが利用可能になることに注意して、[clone select example(選択したサンプルのクローン)]をクリックします
次に、クローンを作成するプロジェクトを選択します。この例では、GPIO LED出力プロジェクトを使用します。フィルタのボックスに「sctimer」と入力してプロジェクトを絞り込み、「
sctimer_pwm_with_dutycycle_change」サンプル・プロジェクトを選択します。また、プロジェクトのクローンの作成先と名前を指定することもできます。[Finish(完了)]をクリックします。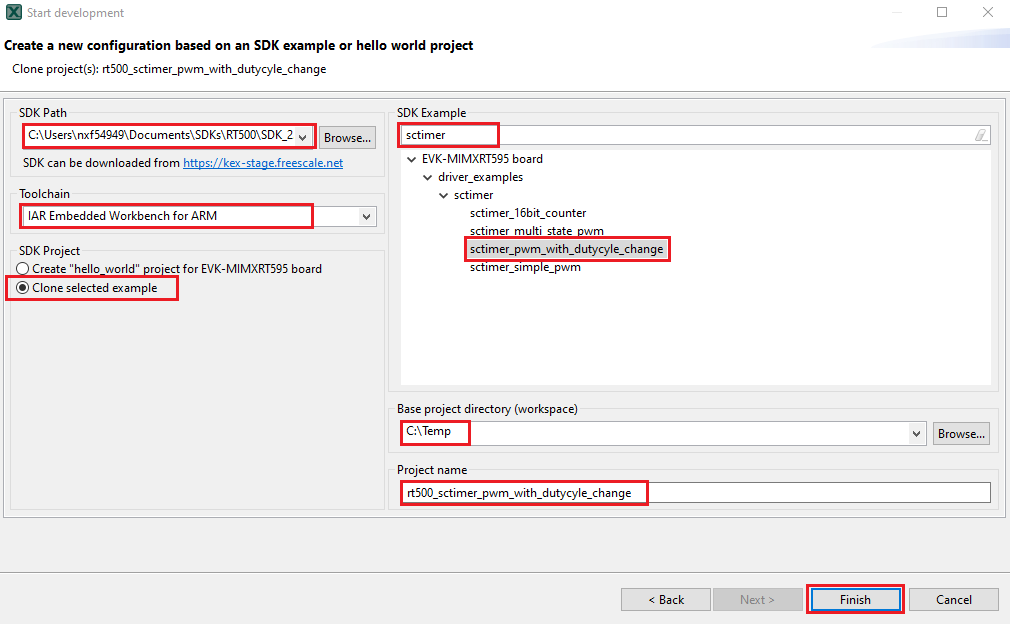
- クローンの作成後、選択したディレクトリに移動し、IDEでプロジェクトを開きます。前のセクションで行ったように、プロジェクトをインポート、コンパイル、および実行します
- 赤色LEDの輝度が変化します
- デバッグ・セッションを終了します
4.2 ピン・ツールの使用
次に、MCUXpresso Config Toolの一部であるピン・ツールを使用して、点滅しているLEDを異なる色のLEDに変更します。
MCUXpresso IDEのピン・ツールを使用する
MCUXpresso IDEのピン・ツールを開くには
- 「
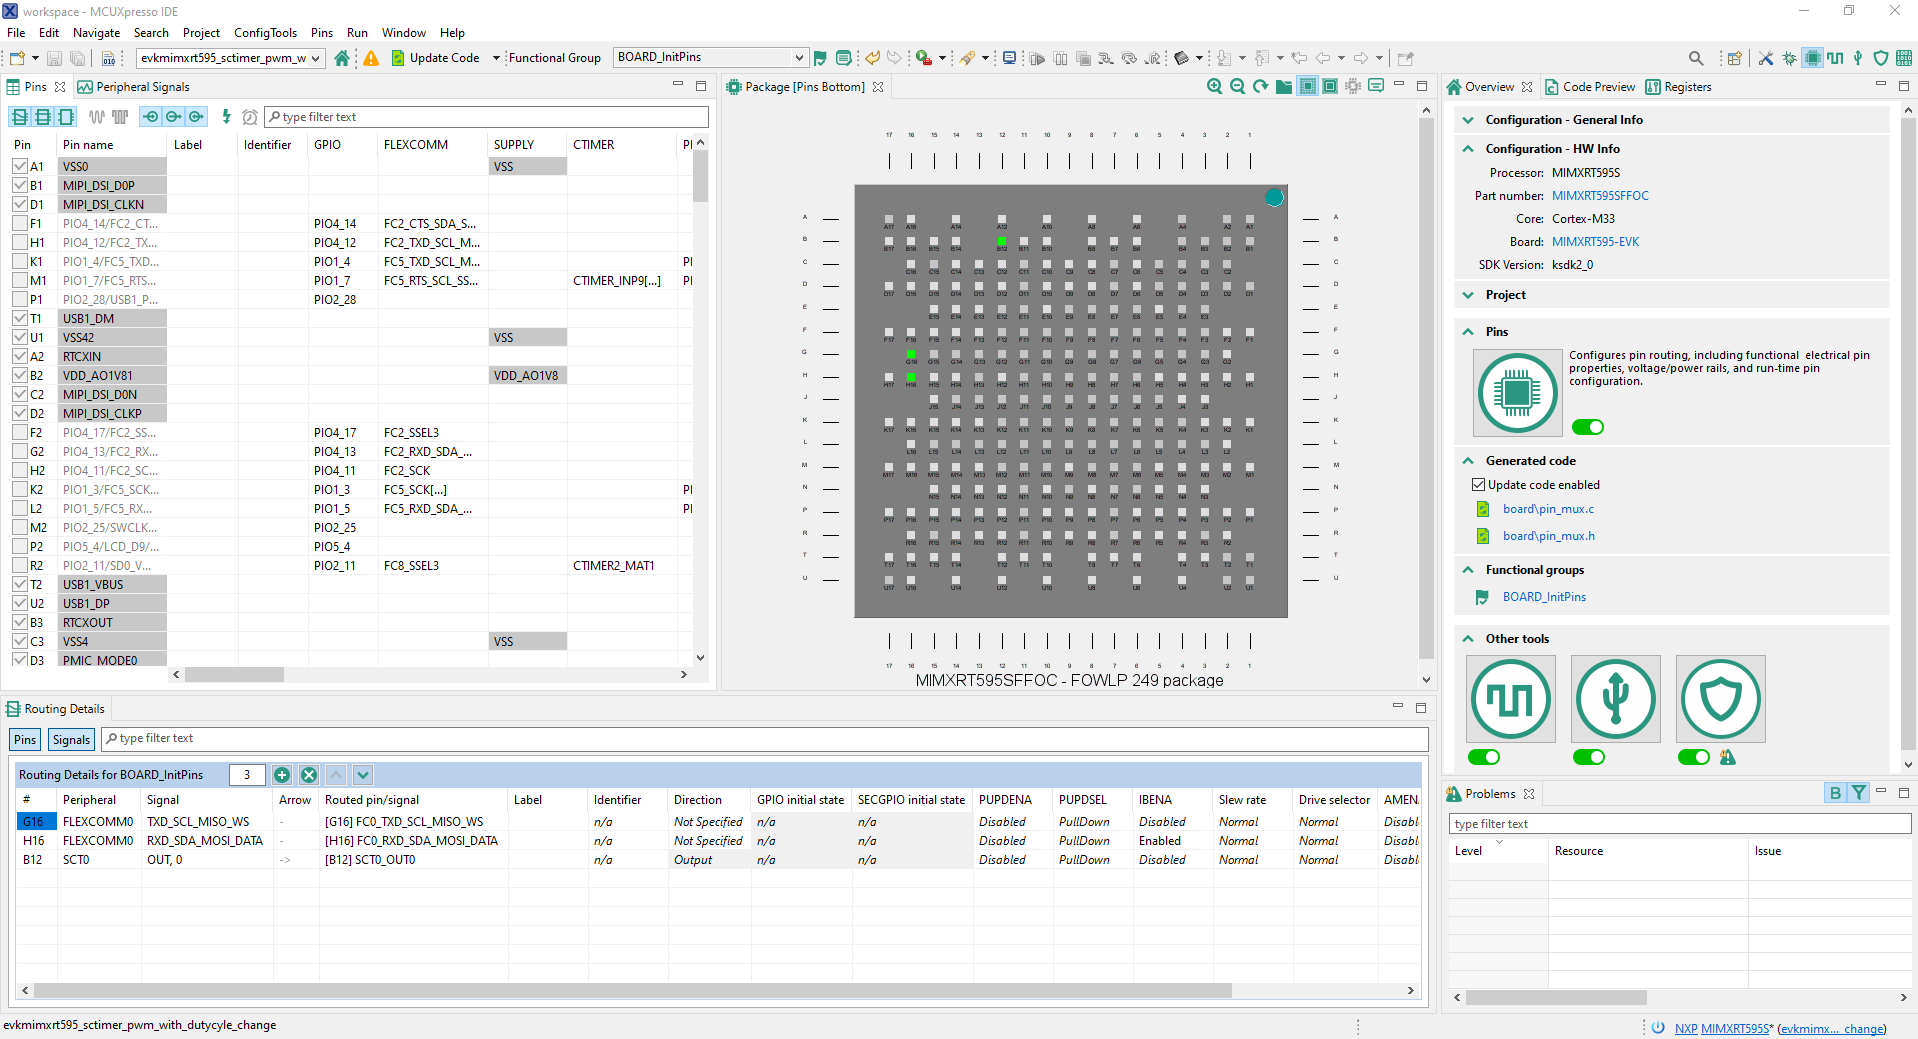
evkmimxrt595_sctimer_pwm_with_dutycycle_change」プロジェクトを右クリックし、[MCUXpresso Config Tools]、[Open Pins(ピンを開く)]の順に選択することで、ピン・ツールを開きます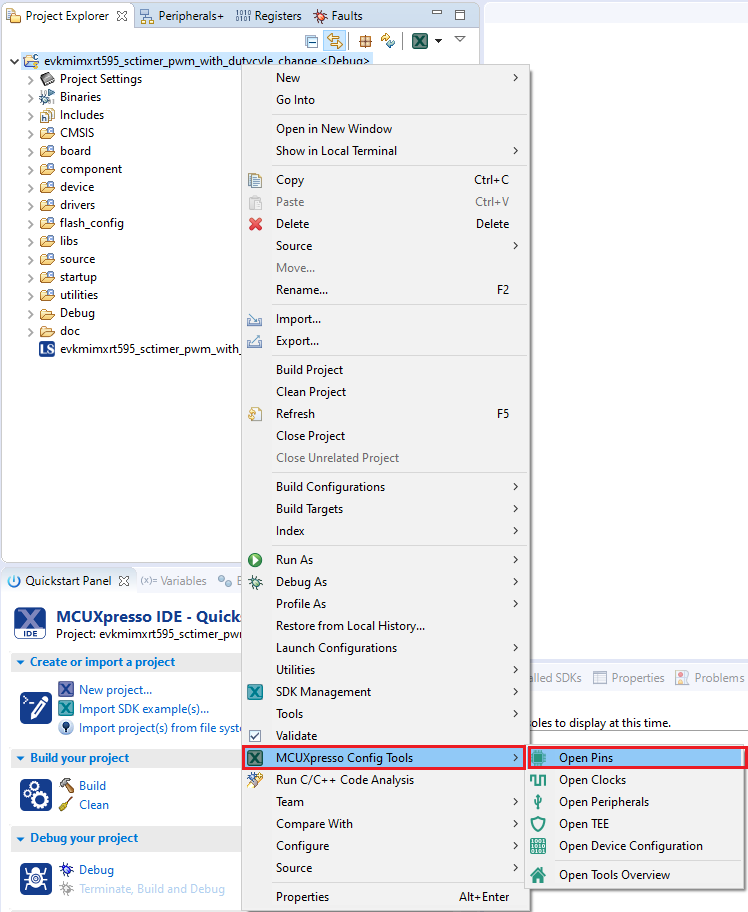
- これで、ピン・ツールにSCTプロジェクトのピン構成が表示されます
MCUXpresso Config Toolsのピン・ツールを開くには
- MCUXpresso Config Toolsを開きます
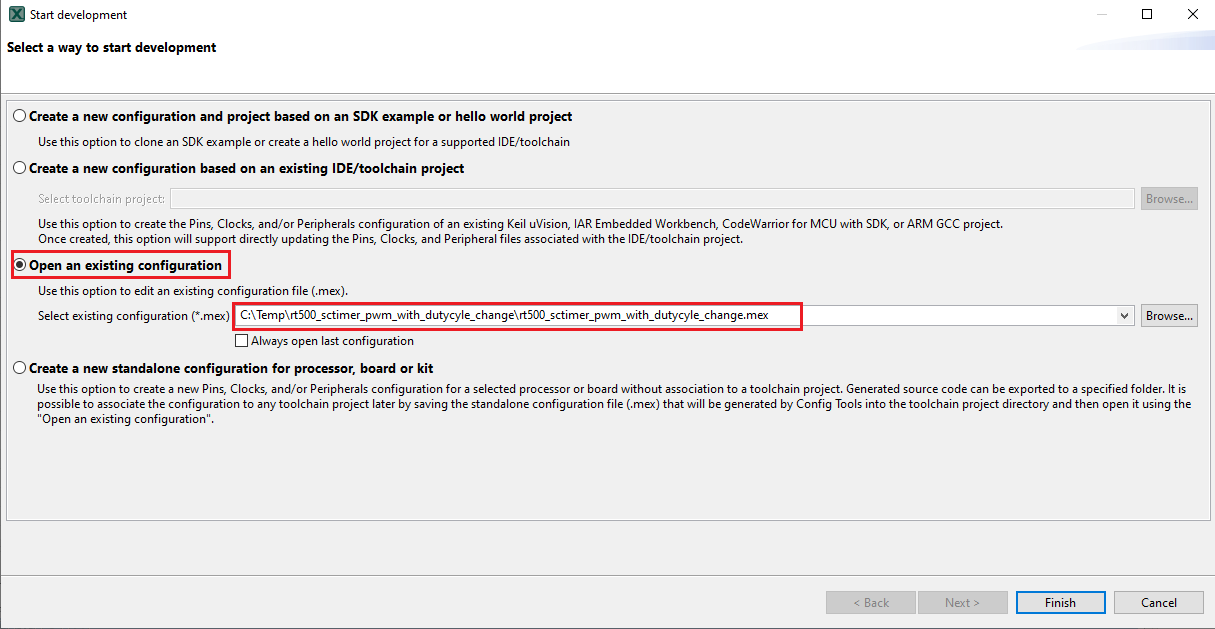
- 表示されるウィザードで、[Open existing configuration(既存の構成を開く)]ラジオ・ボタンを選択したら、クローンを作成したプロジェクトを選択し、[Next(次へ)]をクリックします
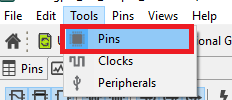
- ツールバーの[Tools(ツール)]>[Pins(ピン)]を選択して、ピン・ツールを開きます
- これで、ピン・ツールにSCTimerプロジェクトのピン構成が表示されます
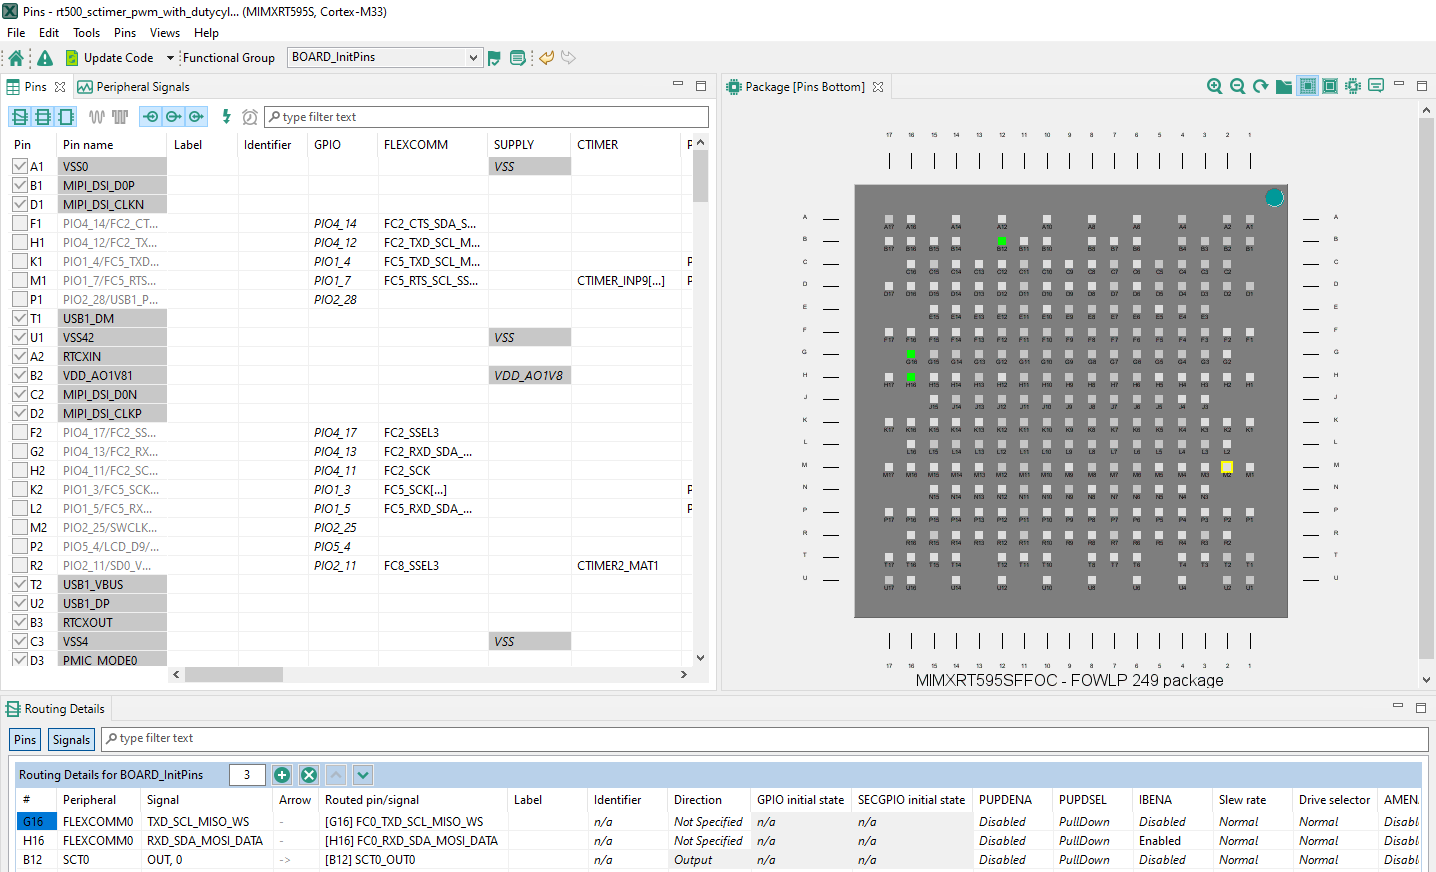
- 以降の手順ではMCUXpresso IDEを使用しますが、サード・パーティ製IDE向け MCUXpresso Config toolsの場合も同じ手順で実行できます。[Pins(ピン)]ビューの[Show dedicated pins(専用ピンを表示)]および[Show not routed pins(ルーティングされていないピンを表示)]のチェックボックスのチェックを外し、ルーティングされているピンのみを表示させます。ルーティングされたピンには、ピンの名称の横に緑色のボックスが表示されます。ルーティングされた各ピンに選択された機能は、緑色にハイライト表示されます
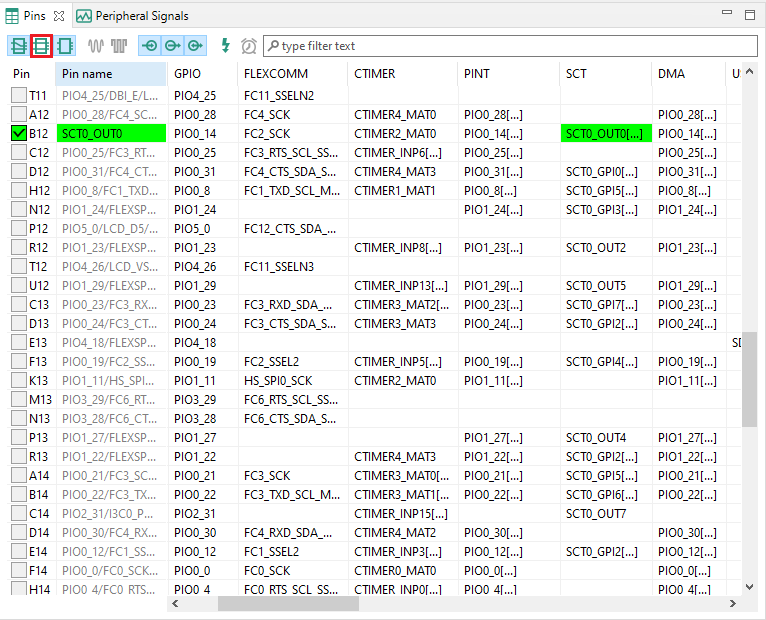
- 現在の設定では、PIO0_14がSCT0_OUT0としてルーティングされています。PIO0_14を無効にし、SCT0_OUT7の機能を使用するためにPIO1_0のmux設定を変更します
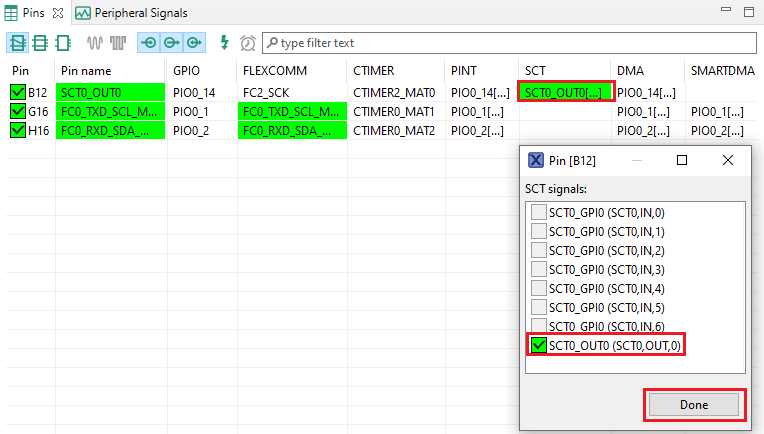
- SCT列の下にある[SCT0_OUT0]フィールドをクリックして、PIO0_14を無効にします。新しいウィンドウが表示されます。「SCT0_OUT0」のチェックボックスの選択を外し、[Done(完了)]をクリックします。これによりピンが無効になります(ピンのボックスのチェックが外れます)。したがってリストからも削除されます
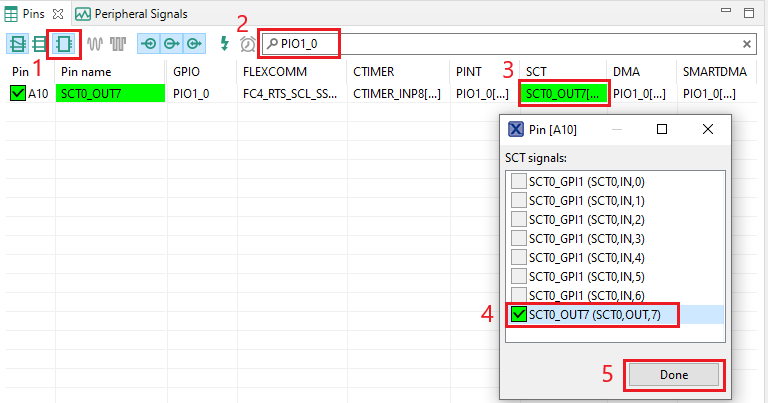
- 次に、PIO1_0をSCT_OUT7としてルーティングします。最初に、[Show not routed pins(ルーティングされていないピンを表示)]を選択し、すべてのピンを再表示させます。次に、[Pins(ピン)]ビューで「PIO1_0」を検索します。最後に、SCT列の[SCT_OUT7]のボックスをクリックします。ボックスが緑色でハイライト表示され、ピンの横にチェックが表示されます
- 次に、ピン・ツールによって生成された、新たに更新された
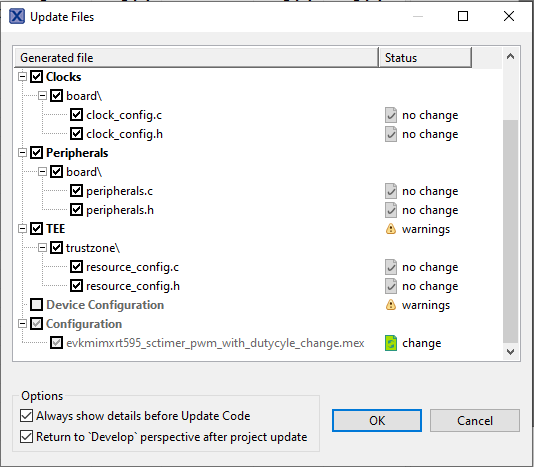
pin_mux.cファイルとpin_mux.hファイルをエクスポートして、これらの変更をプロジェクトに実装します。メニュー・バーの[Update Project(プロジェクトの更新)]をクリックします
- ポップアップ画面に変更中のファイルが表示されます。[diff]をクリックすると、現在のファイルとピン・ツールで生成された新しいファイルとの違いを確認できます。[OK]をクリックして、新しいファイルをプロジェクトに上書きします
- 次に、IDE内で「Board(ボード)」フォルダの下にある
pinmux.cファイルを開きます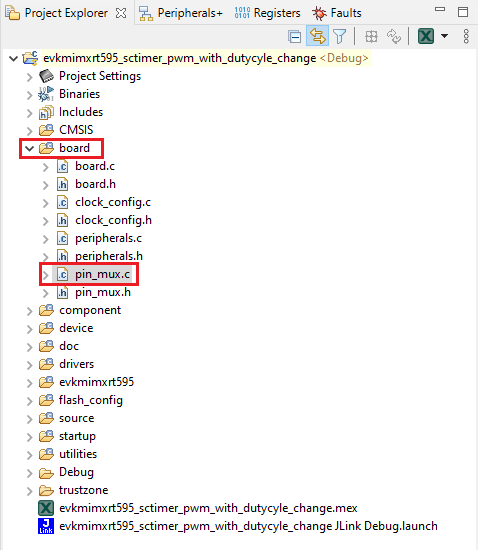
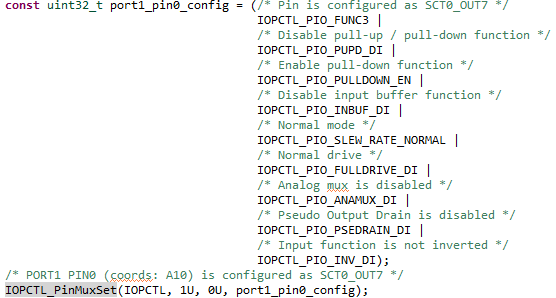
- BOARD_InitPins(void) 機能を探します。ツールでSCTがルーティングされたピンを変更する際に、PIO0_14が選択されてSCT_OUT (赤色LED)として設定されたことに注意してください。これでPIO1_0の宣言が行われ、SCT_OUT(緑色LED)として設定されました
sctimer_update_dutycycle.cファイルを開き、マクロ「DEMO_SCTIMER_OUT」を「kSCTIMER_Out_7」に変更します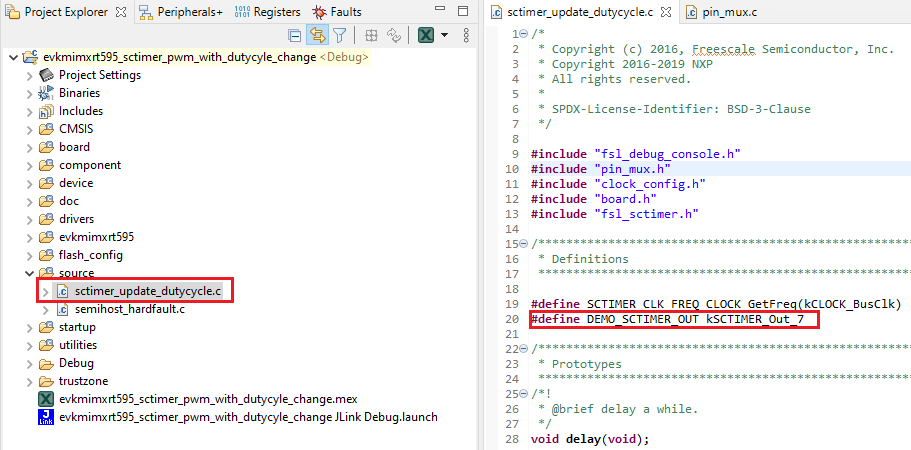
- 前のセクションで行ったように、プロジェクトをビルドしてダウンロードします
- アプリケーションを実行します。これにより、緑色LEDの輝度が変化します
- デバッグ・セッションを終了します
4.3 クロック・ツールの使用
次に、MCUXpresso Config Toolsの一部であるクロック・ツールを使用し、クロックの設定とLEDの点滅速度を変更します。
MCUXpresso IDEのピン・ツールを使用する
MCUXpresso IDEのピン・ツールを開くには
- 「
evkmimxrt595_sctimer_pwm_with_dutycycle_change」プロジェクトを右クリックし、[MCUXpresso Config Tools]、[Open Pins(ピンを開く)]の順に選択することで、ピン・ツールを開きます - これで、ピン・ツールにSCTプロジェクトのピン構成が表示されます。
MCUXpresso Config Toolsのピン・ツールを開くには
- MCUXpresso Config Toolsを開きます。
- 表示されるウィザードで、[Open existing configuration(既存の構成を開く)]ラジオ・ボタンを選択したら、クローンを作成したプロジェクトを選択し、[Next(次へ)]をクリックします。
- ツールバーの[Tools(ツール)]>[Pins(ピン)]を選択して、ピン・ツールを開きます。
- これで、ピン・ツールにSCTimerプロジェクトのピン構成が表示されます。
ピン・ツールを使用して、LEDがルーティングされたピンを変更する
- 以降の手順ではMCUXpresso IDEを使用しますが、サード・パーティ製IDE向け MCUXpresso Config toolsの場合も同じ手順で実行できます。[Pins(ピン)]ビューの[Show dedicated pins(専用ピンを表示)]および[Show not routed pins(ルーティングされていないピンを表示)]のチェックボックスのチェックを外し、ルーティングされているピンのみを表示させます。ルーティングされたピンには、ピンの名称の横に緑色のボックスが表示されます。ルーティングされた各ピンに選択された機能は、緑色にハイライト表示されます
- 現在の設定では、PIO0_14がSCT0_OUT0としてルーティングされています。PIO0_14を無効にし、SCT0_OUT7の機能を使用するためにPIO1_0のmux設定を変更します
- SCT列の下にある[SCT0_OUT0]フィールドをクリックして、PIO0_14を無効にします。新しいウィンドウが表示されます。「SCT0_OUT0」のチェックボックスの選択を外し、[Done(完了)]をクリックします。これによりピンが無効になります(ピンのボックスのチェックが外れます)。したがってリストからも削除されます
- 次に、PIO1_0をSCT_OUT7としてルーティングします。最初に、[Show not routed pins(ルーティングされていないピンを表示)]を選択し、すべてのピンを再表示させます。次に、[Pins(ピン)]ビューで「PIO1_0」を検索します。最後に、SCT列の[SCT_OUT7]のボックスをクリックします。ボックスが緑色でハイライト表示され、ピンの横にチェックが表示されます
- 次に、ピン・ツールによって生成された、新たに更新された
pin_mux.cファイルとpin_mux.hファイルをエクスポートして、これらの変更をプロジェクトに実装します。メニュー・バーの[Update Project(プロジェクトの更新)]をクリックします - ポップアップ画面に変更中のファイルが表示されます。[diff]をクリックすると、現在のファイルとピン・ツールで生成された新しいファイルとの違いを確認できます。[OK]をクリックして、新しいファイルをプロジェクトに上書きします
- 次に、IDE内で「Board(ボード)」フォルダの下にある
pinmux.cファイルを開きます - BOARD_InitPins(void) 機能を探します。ツールでSCTがルーティングされたピンを変更する際に、PIO0_14が選択されてSCT_OUT (赤色LED)として設定されたことに注意してください。これでPIO1_0の宣言が行われ、SCT_OUT(緑色LED)として設定されました
sctimer_update_dutycycle.cファイルを開き、マクロ「DEMO_SCTIMER_OUT」を「kSCTIMER_Out_7」に変更します- 前のセクションで行ったように、プロジェクトをビルドしてダウンロードします
- アプリケーションを実行します。これにより、緑色LEDの輝度が変化します
- デバッグ・セッションを終了します
4.4 成功
アプリケーションが変更され、MIMXRT595-EVKの緑色RGB LEDが点滅します。
LPCScryptチュートリアル
LPCScryptチュートリアル
LPCScryptは、LPCマイクロコントローラ用のコマンドライン・ベースの高速フラッシュ、EEPROM、OTP、セキュリティのプログラミング・ツールです。最新のCMSIS-DAPおよびJ-Linkファームウェアのプログラム用として推奨されるツールです。
- 下のボタンを使用してLPCScryptツールをダウンロードし、プラットフォームをWindows、MAC OC X、Linuxの中から選択します。ダウンロードしたら、インストーラを実行します。インストール時には、すべてのプラットフォームに対してDFUとVCOMのドライバが自動的にインストールされます。
- LPC-Link2デバッグ回路ファームウェアをアップデートするには、
J40のUSBケーブルを取り外し、DFULinkジャンパを接続します。- MIMXRT595-EVKでは、
JP1はLPCXpressoのDFUです。ジャンパを使用してJP1を接続します。 - デバッグ・リンクのUSBコネクタ
J40を使って、ボードをホスト・コンピュータに再接続します。
- MIMXRT595-EVKでは、
- LPCScryptをインストールした
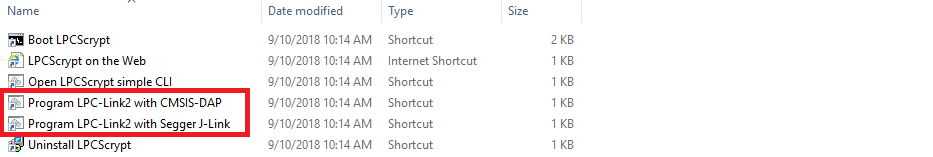
C:\ProgramData\Microsoft\Windows\Start Menu\Programs\LPCScryptにある「Boot LPCScrypt」ファイルをダブルクリックして、LPCScryptを起動します。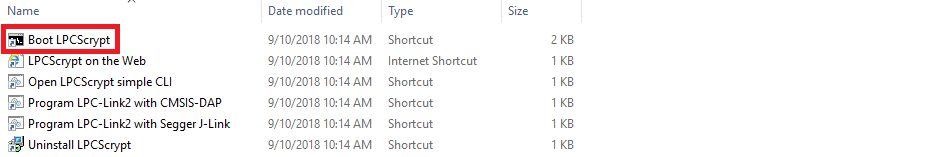
- コマンド・シェルで、JLINKスクリプトを実行してJLinkデバッグ・ファームウェアをインストールします
備考
- このドキュメントでは、Windowsのディレクトリ・セパレータを使ってファイル・パスを表記しています。LinuxまたはMac OSXの場合、ディレクトリ・セパレータを「/」に置き換える必要があります。
- Windowsユーザーの場合、[スタート]メニューに「LPCScrypt」を登録することで、これらのスクリプトへのショートカットが利用できます。
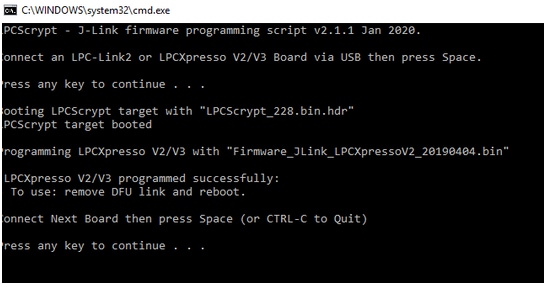
- コマンド・シェルで、JLINKスクリプトを実行してJLinkデバッグ・ファームウェアをインストールします
- ファームウェアを選択すると(今回はJ-Link)、コンソールにLPCScryptコマンド・ウィンドウが以下のように表示されることを確認します。
- プログラミングが完了したら、ボードをホストから外します。これで準備完了です。DFULinkジャンパを取り外し、ボードをホスト・コンピュータに再接続します。ホストのUSBシステム上にプローブのリストが表示されます。
MCUXpresso IDEターミナル・チュートリアル
MCUXpresso IDEターミナル・チュートリアル
最新バージョンのMCUXpresso IDEには、ターミナル・エミュレーション・アプリケーションが含まれています。このツールは、お使いのNXP開発プラットフォームの仮想シリアル・ポートから送信された情報を表示するために使用できます。
- MCUXpresso IDEを開きます
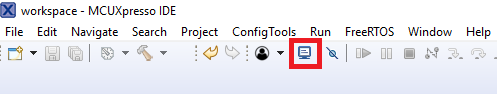
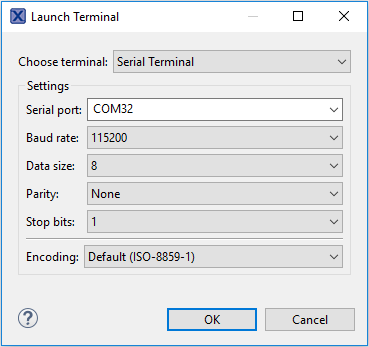
- MCUXpresso IDEの画面上部にある[Open a Terminal(ターミナルを開く)]ボタンをクリックするか、[Ctrl + Alt + Shift + T]を同時に押して、MCUXpresso IDEターミナルを起動します。
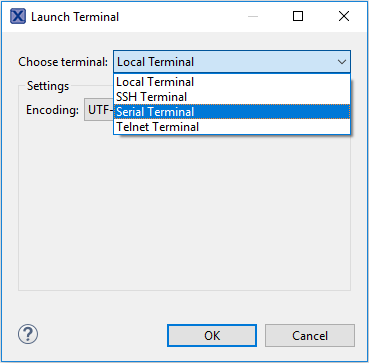
- シリアル・ターミナルを選択します
- シリアル・ポート(LPC-Link2のCOMポート番号を使用)をボーレート115200、8データ・ビット、パリティなし、1ストップ・ビットに設定し、[OK]ボタンをクリックします
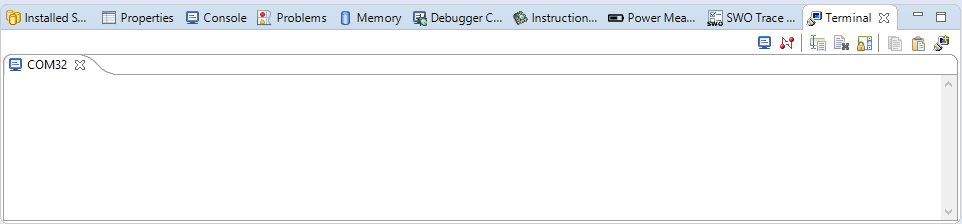
- 接続が確立されているか検証します。接続されている場合、MCUXpresso IDEの[Terminal(端末)]ビューの表示は下図のようになります
- 以上で設定は完了です

Tera Termチュートリアル
Tera Termチュートリアル
Tera Termは、広く利用されているオープン・ソースのターミナル・エミュレーション・アプリケーションです。このプログラムを使用して、NXP開発プラットフォームの仮想シリアル・ポートから送信された情報を表示できます。
- SourceForgeからTera Termをダウンロードします。ダウンロードしたら、インストーラを実行し、このウェブページに戻って手順を続行します
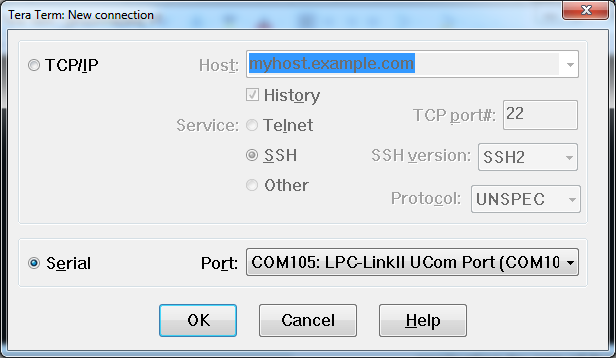
- Tera Termを起動します。初めて起動する際には、次のダイアログが表示されます。シリアル・オプションを選択します。ボードが接続されている場合は、COMポートが自動的にリスト内に表示されます
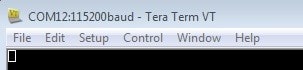
- 事前に確認したCOMポート番号を使用して、シリアル・ポートをボーレート115200、8データ・ビット、パリティなし、1ストップ・ビットに設定します。この設定は[Setup(セットアップ)]>[Serial Port(シリアル・ポート)]から行うことができます
- 接続が確立されているか検証します。確立されている場合、Tera Termのタイトル・バーに次のように表示されます
PuTTYチュートリアル
PuTTYチュートリアル
PuTTYは、広く利用されているターミナル・エミュレーション・アプリケーションです。このプログラムを使用して、NXP開発プラットフォームの仮想シリアル・ポートから送信された情報を表示できます。
- 下のボタンをクリックしてPuTTYをダウンロードします。ダウンロードしたら、インストーラを実行し、このウェブページに戻って手順を続行します
- 選択したダウンロードのタイプに応じて、ダウンロードした*.exeファイルをダブルクリックするか、[Start(スタート)]メニューから選択して、PuTTYを起動します
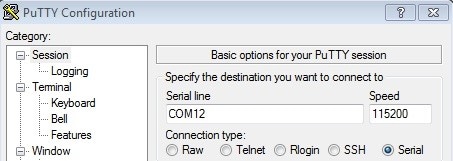
- 表示されたウィンドウで設定を行い、[Serial(シリアル)]ラジオ・ボタンを選択して、事前に確認したCOMポート番号を入力します。ボーレートもあわせて指定します。今回は115200を入力します
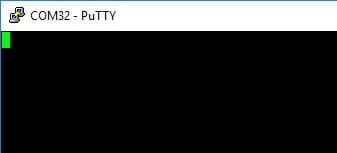
- [Open(開く)]をクリックして、シリアル接続を確立します。ボードが接続されていて、正しいCOMポートが入力されていれば、ターミナル・ウィンドウが開きます。設定が正しくない場合は、アラートが表示されます
- 以上で設定は完了です
SEGGER J-Linkチュートリアル
SEGGER J-Linkチュートリアル
- J-Linkソフトウェアをダウンロードします
SEGGERのダウンロード・ページ Seggerにアクセスします。
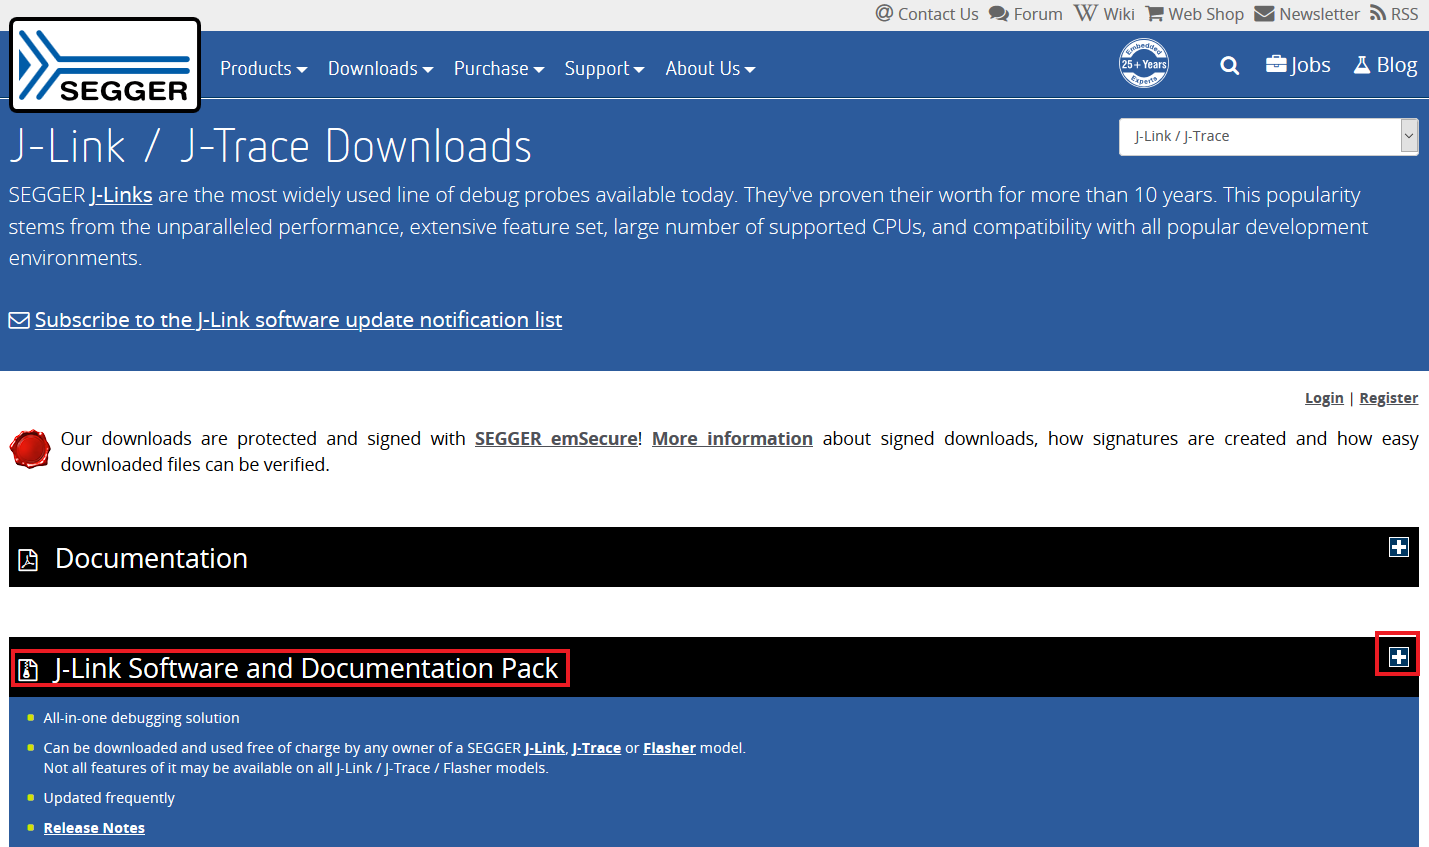
- 「J-Link Software and Documentation Pack(J-Linkソフトウェアおよびドキュメント・パック)」セクションを展開します
- お使いのOSに対応するソフトウェアを選択し、最新版をダウンロードします
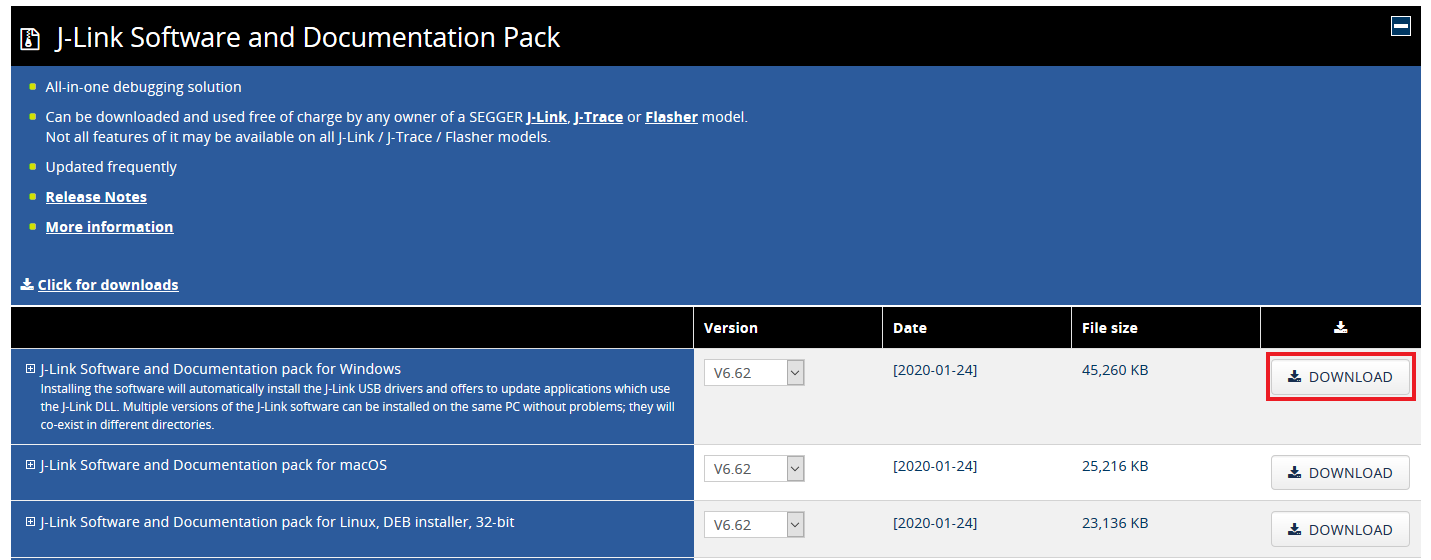
規約に同意して、ソフトウェアをダウンロードします
- ダウンロードした
.exeファイルをダブルクリックして実行します。J-Linkのインストールが完了するまで、セットアップ手順に従って操作を進めます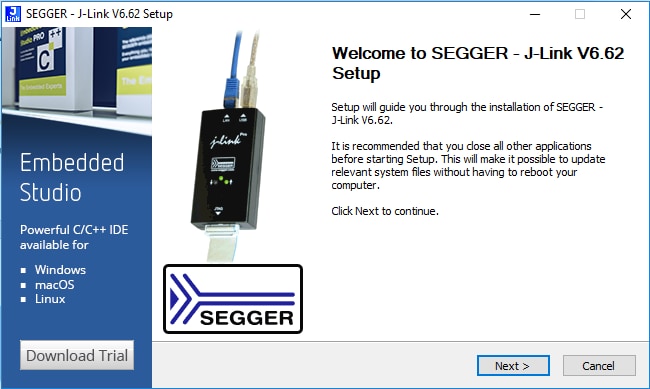
- 以上で設定は完了です
Xtensa Xplorerチュートリアル
Xtensa Xplorerチュートリアル
Cadence® Tensilica® Xplorerは、ユーザーによる高性能Tensilica®プロセッサ用のアプリケーション・コードの作成を支援する包括的な開発環境です。Xplorerは、XCCコンパイラ、アセンブラ、リンカ、デバッガ、コード・プロファイラ、フルセットのGUIツールなどのパワフルなソフトウェア開発ツールへのインターフェースです。
Xplorer(GUIとコマンド・ライン環境の両方を含む)はMIMXRT500のDSPコアで利用可能な唯一の開発用IDEです。
- プロファイルを作成します。これはTensilica Toolsをダウンロードするために必要となります。URL Fusion f1 DSP SDK for RT500にアクセスして、ログインしてください。初めてアクセスする場合は、最初に登録してください。

「Tensilica tools」からアクティベーション・リンクを記載した確認メールが届きます。アクティベーション・リンクをクリックして登録を完了させます。
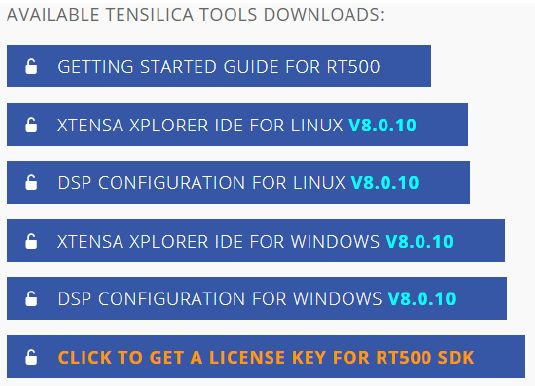
- Xtensa Xplorer IDEをインストールします。登録が完了したら、ログインしてください。利用可能なツールが表示されます
- お使いのOS向けの「Xtensa Xplorer IDE 8.0.10」をダウンロードしてインストールしてください
- お使いのOS向けの「DSP構成」をダウンロードします。これは後ほど(ステップ5で)インストールします
- ライセンス・キーをダウンロードします。正しいライセンス・ファイルを生成するには、まず、Xtensaツールを実行するコンピュータの正確なMACアドレスを調べる必要があります。コマンド・プロンプトを開き、次のように入力します。
Windows:
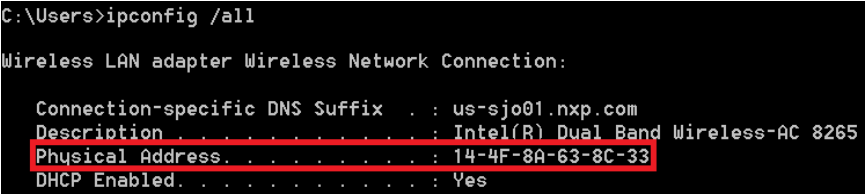
Linux:

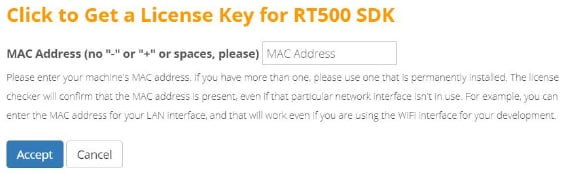
再読み込みしてTensilicaのURL Fusion f1 DSP SDK for RT500に戻り、[Get a License Key for RT500 SDK(RT500 SDKのライセンス・キーを取得する)]をクリックします。

「-」や 「:」の記号を省いたMACアドレスを入力します。
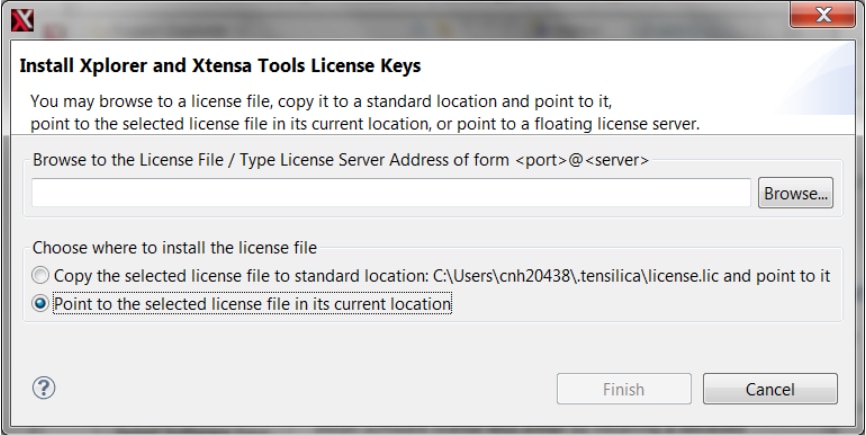
- ライセンス・キーをインストールします。ライセンスが生成およびダウンロードされたら、Xplorer IDEを開き、メニューから[Help(ヘルプ)]>[Xplorer License Keys(Xplorerライセンス・キー)]>[License Options(ライセンス・オプション)]>[Install Software Keys(ソフトウェア・キーのインストール)]の順に選択します。ライセンス・キーのファイルを選択し、[Finish(完了)]をクリックします。
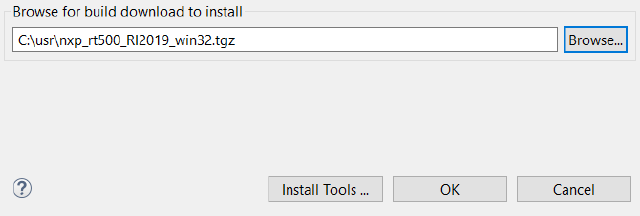
- RT500 DSPのビルド構成をインストールします。ビルドの構成は、デフォルトで画面の左下隅にある[System Overview(システムの概要)]パネルを使用してIDEにインストールできます。このパネルが表示されない場合は、メニュー項目から[Window(ウィンドウ)]>[Show View(ビューの表示)]>[System Overview(システムの概要)]を使用して表示を切り替えることができます
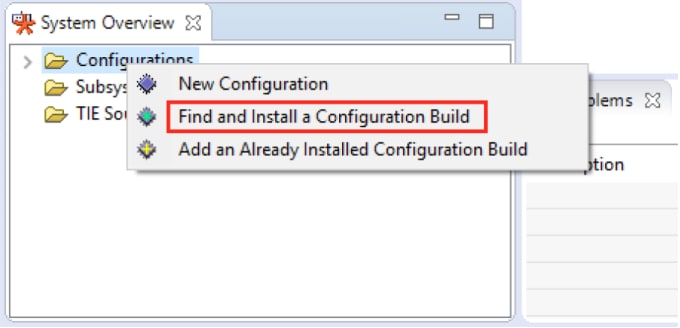
ステップ2でダウンロードした構成を検索します。
- Xtensa On Chip Debuggerデーモンをインストールします。Xtensa On Chip Debuggerデーモン (xt-ocd) は、gdb ベースのパワフルなデバッグ・ツールです。Xplorer IDEには、デフォルトではインストールされていません。自己解凍型実行ファイルのインストーラがIDEに含まれています。これは次の場所にあります。
Windows:
“C:\usr\xtensa\XtDevTools\downloads\RI2019.1\tools\xt-ocd-14.0.1-windows64-installer.exe”Linux:
“~/xtensa/XtDevTools/downloads/RI2019.1/tools/xt-ocd-14.0.1-linux64-installer”現時点では、xt-ocdはRT500向けにJ-LinkプローブおよびSWD (Serial Wire Debug) でのArm RVI/DSTREAMプローブをサポートしています。Xt-ocdによってJ-Linkプローブのサポートはインストールされますが、必須のJ-Linkドライバはインストールされません。それらは個別にインストールする必要があります。RT500ではJ-Linkソフトウェア・バージョン6.92以降が必要です。
- LPC-Link2のJlinkシリアル番号を確認します。JLINK commanderを実行して、シリアル番号を確認してください。これは次の場所にあります。“
C:\Program Files (x86)\SEGGER\JLink”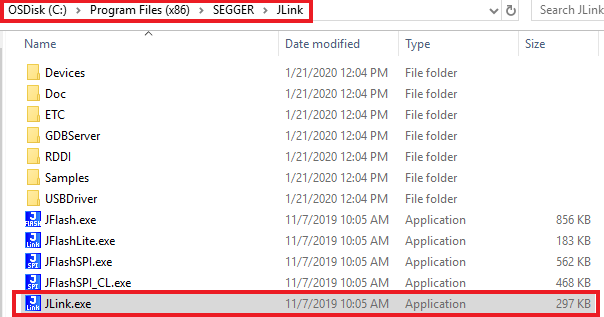
すべてのEVK/LPC-Link2でJlink S/Nが異なります。
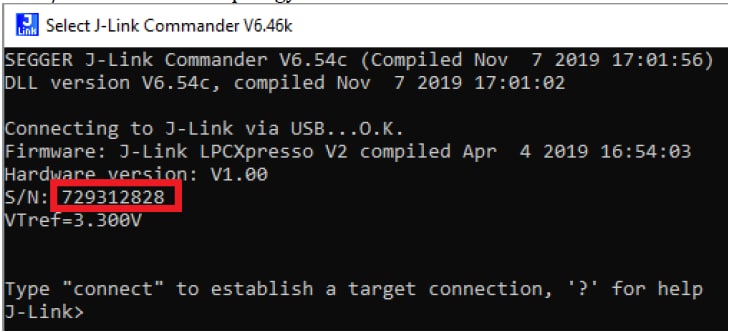
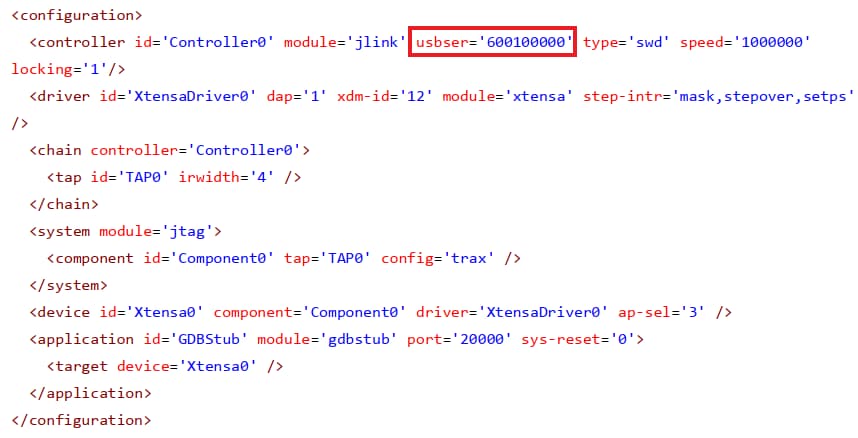
トポロジ・ファイルを編集します。xt-ocdは「
topology.xml」という名前のXML入力ファイルで構成されます。このファイルは、Xtensa OCDがインストールされたディレクトリ“C:\Program Files (x86)\Tensilica\Xtensa OCD Daemon 14.01”にあります。このファイルをお使いのデバッガ・ハードウェア用に変更する必要があります。例に示したJ-linkを使用する場合、このtopology.xmlファイルで元のファイルを置き換えてください。または、以下の例のいずれかをコピーします
「usbser」セクションを独自のJlinkシリアル番号(前のステップで取得した9桁の番号)に置き換える必要があることに注意してください。
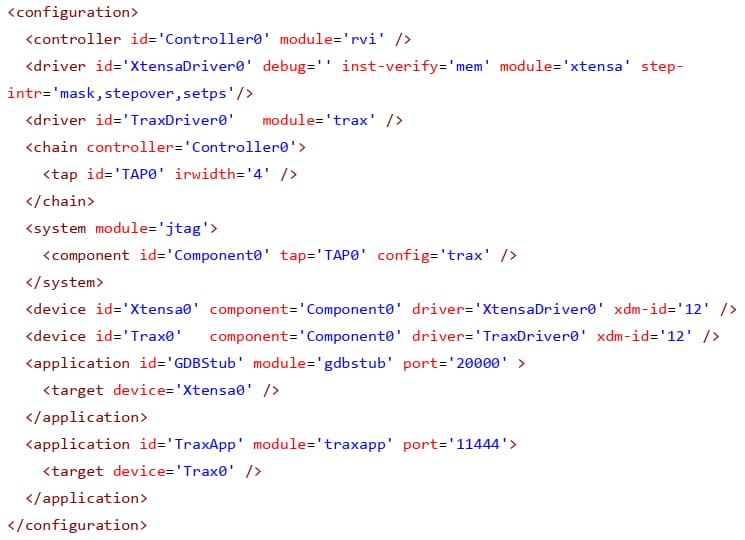
Arm RealView ICE (RVI) とDSTREAMデバッグ・プローブを使用する場合の別のtopology.xmlの例を以下に示します。
設計・リソース
関連リソース
センサ
豊富な品揃えのNXPセンサ・ソリューションで、世界に目を向けましょう。NXPなら、加速度センサ、圧力センサ、タッチ・センサなど、プロジェクトに適したセンサ・ソリューションを見つけることができます。詳細については、センサをご覧ください
NFC
NFC (Near Field Communication) は、簡単なタッチだけで周りの世界とセキュアにやり取りできるシンプルで直感的なテクノロジです。NXPのNFCソリューションの詳細については、NFC - Near Field Communicationをご覧ください
Wi-Fi
i.MX RTプラットフォームを使用したNXP Wi-Fiモジュールのスタート・ガイド - Wi-Fiモジュールの動作テストを行いましょう。このガイドでは、Wi-Fiモジュールとi.MX RTプラットフォームを使用します
サポート
フォーラム
他のエンジニアとつながり、i.MXプロセッサとMCUXpressoのソフトウェアやツールを使用した設計に関して専門的なアドバイスを受けることができます。i.RTコミュニティ、MCUXpressoソフトウェアおよびツール・コミュニティという2つの専門コミュニティのいずれかで、コミュニティ・ディスカッションにご参加ください。