FRDM-K64Fのスタート・ガイド
このドキュメントの内容
-
接続
-
ソフトウェアの入手
-
ビルドと実行
サインイン 進行状況を保存するには アカウントをお持ちでない方 アカウントを作成する。
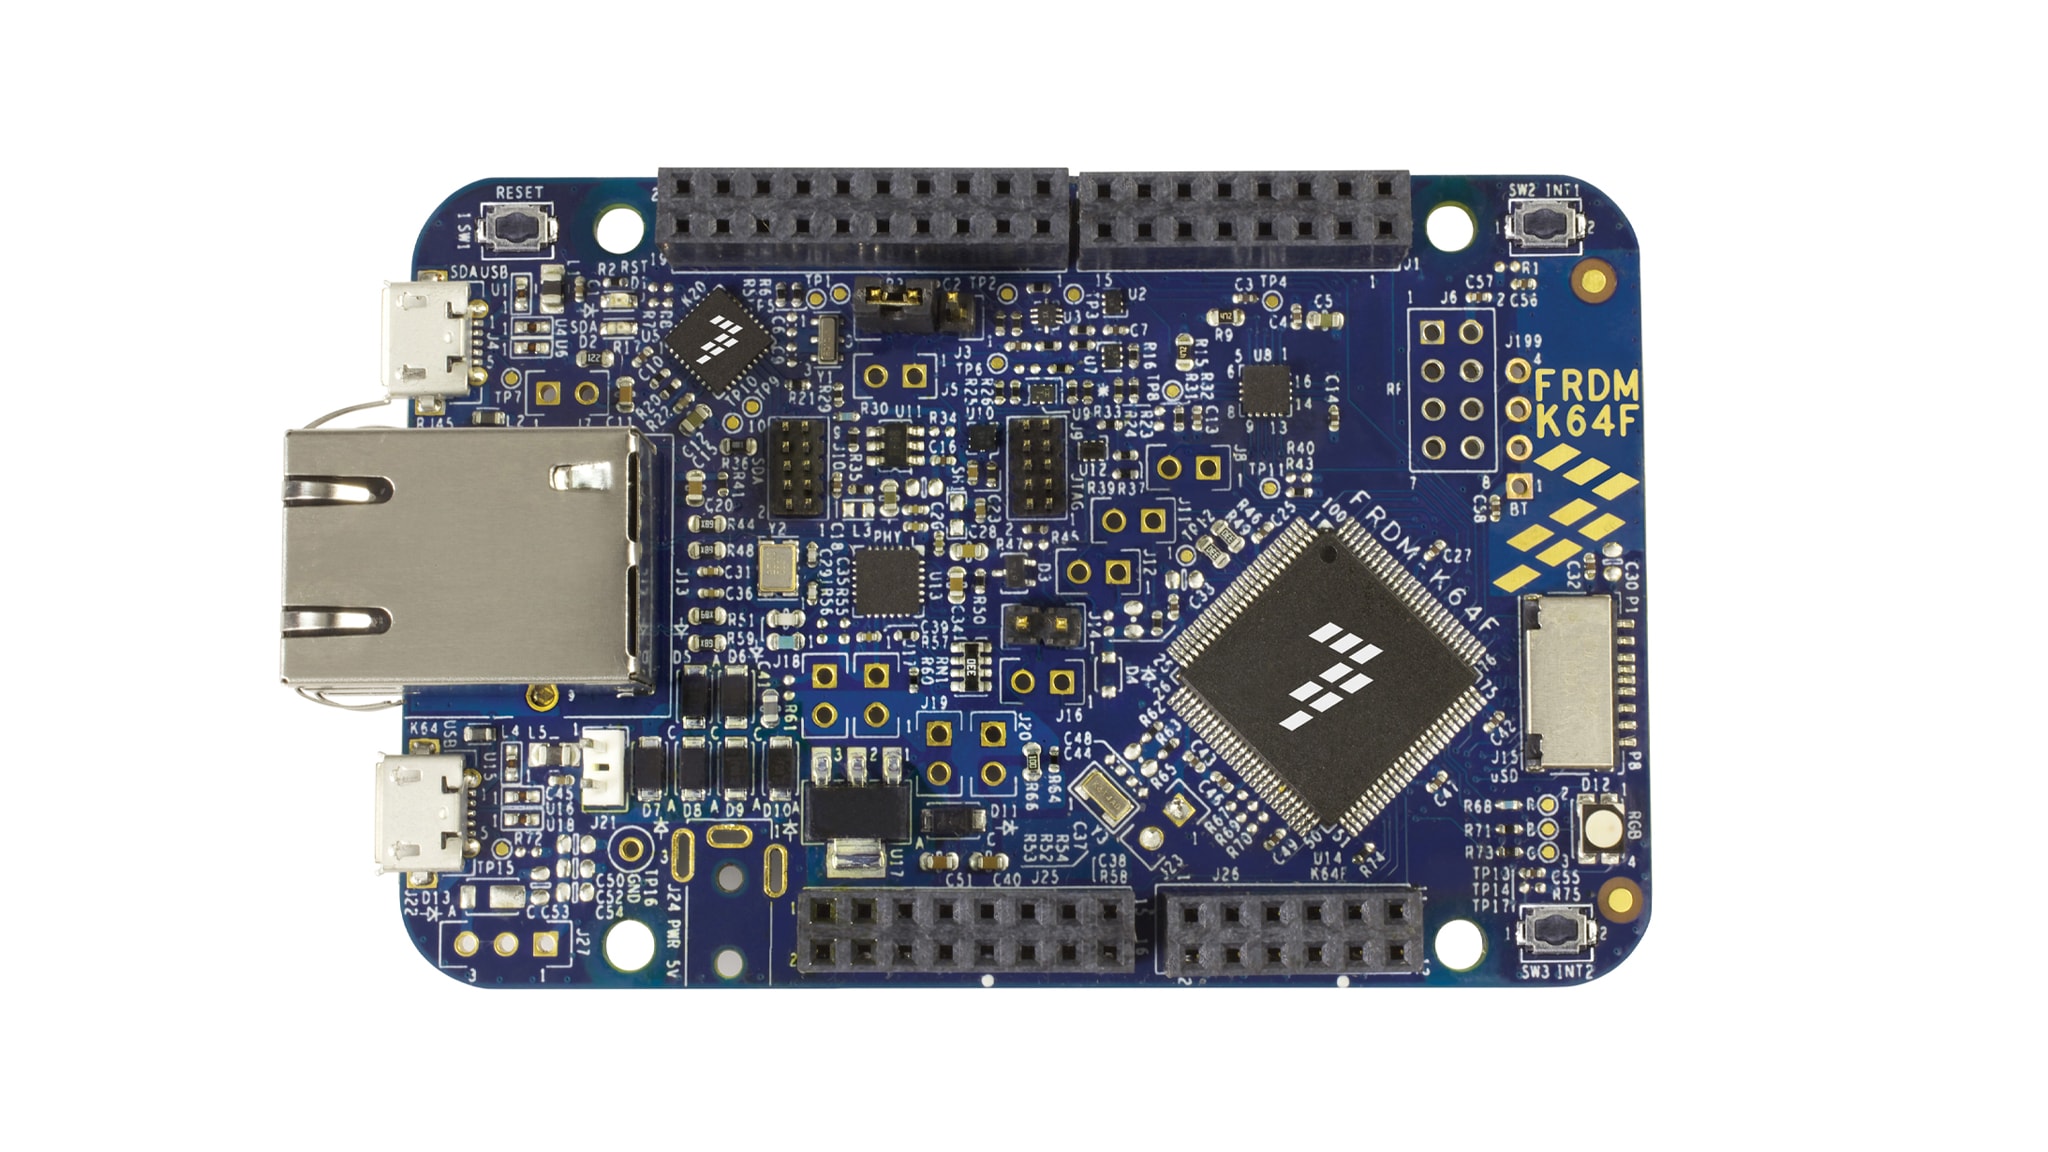
お客様の FRDM-K64F | K64/K63/K24 | Dev Platform
1. 接続
1.1 FRDM-K64Fの接続前の重要な情報
OpenSDAは、多くのNXP開発ボードに組み込まれているKinetis K20デバイス上で動作するシリアルおよびデバッグ・アダプタ回路です。
これにより、ユーザーはUSBケーブルを使用するだけで、ターゲットのK64Fチップにプログラムをダウンロードしてデバッグすることができます。
Windows 10ではマス・ストレージ・デバイスの扱いが変更されたため、一部のFRDM-K64Fボードに搭載されている旧版のOpenSDAファームウェアがWindows 10に対応しない場合があります。その場合、FRDM-K64Fボードに搭載されている旧版のOpenSDAファームウェアが破損するおそれがあります。
現在ディストリビュータから出荷されている大多数のFRDM-K64Fボードには、これに該当しないアップデート済みのファームウェアが既に搭載されていますが、一部の在庫品には依然として古いファームウェアが搭載されている可能性があります。
Windows 10でFRDM-K64Fを適切に動作させるために、ボードを初めて接続する前に以下の手順に従ってWindows 10のコンピュータのStorage Servicesを無効にし、必要に応じてOpenSDAファームウェアをアップデートしてください。
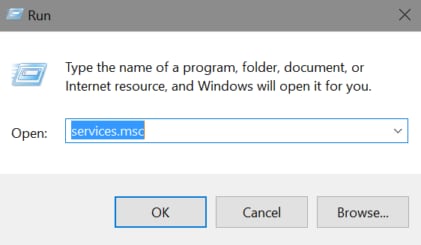
- キーボードの[Windowsロゴ]キーを押しながら[R]キーを押して、[ファイル名を指定して実行]を開きます
- 「services.msc」と入力し、[Ctrl]+[Alt]キーを押しながら[Enter]キーを押して、[サービス]アプリケーションを「管理者モード」で起動します
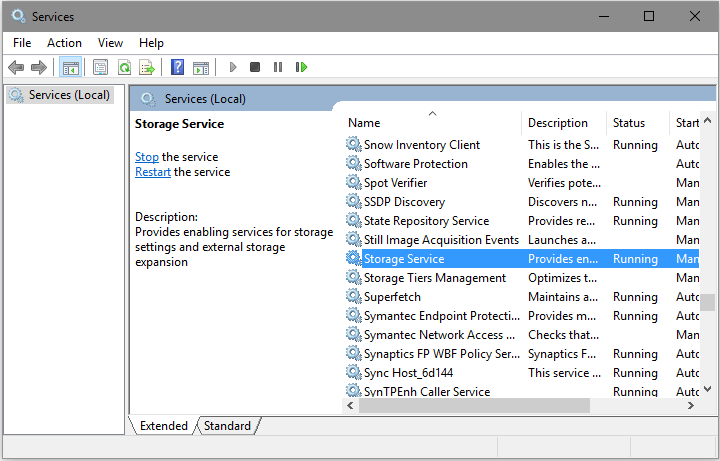
- サービスが開いたら、「Storage Services」の項目を見つけて、ダブルクリックで開きます
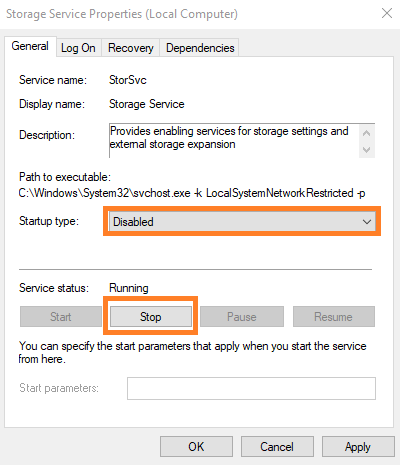
- プロパティ・ボックスが表示されたら、「スタートアップの種類」を[無効]に変更し、[停止]をクリックします。両方のオプションがグレーアウトされている場合は、[サービス]プログラムが「管理者モード」で起動しているか確認してください
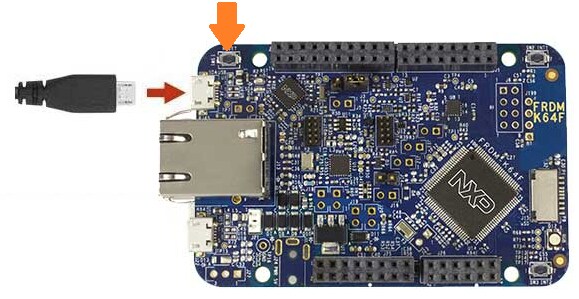
- ここでFRDM-K64Fボードを手に取り、ボードのリセット・ボタンを長押ししながらコンピュータに接続します
- ボードが「MAINTENANCE」という名前のドライブとして列挙される場合、ボードには最新のファームウェアが搭載されているため、それ以上の処置は必要ありません。最後のステップ (#10) に進み、「Storage Services」を再度有効にします。
- ボードが別の名前のドライブとして列挙される場合は、この0244_k20dx_bl_0x5000.binファイルをそのドライブにドラッグ&ドロップします。これにより、OpenSDAブート・ローダが更新されます
- ボードが自動的に「MAINTENANCE」という名前のドライブとして再び列挙されます。このk20dx_frdmk64f_if_crc_legacy_0x5000.binファイルをその「MAINTENANCE」ドライブにドラッグ&ドロップして、OpenSDAのCMSIS-DAPアプリケーションをアップデートします
- ボードは自動的にFRDM-K64FDという名前のドライブとして再び列挙されます。これでOpenSDAブート・ローダとOpenSDAアプリケーションの両方が最新のものに更新され、Windows 10で正しく機能します
- 前と同じ手順で「Storage Services」のダイアログ・ボックスを開いて、「Storage Services」を再度有効にします。「スタートアップの種類」を[自動(遅延開始)]に戻し、[開始]をクリックします
ステップ#6でボードを接続した際にドライブが一切表示されない場合は、WindowsによってOpenSDAファームウェアが破損した可能性があります。破損したファームウェアを修復するには、外部デバッグ・ツールを使用して、OpenSDAファームウェアが実行されるK20チップを再プログラムするしかありません。このプロセスの手順については、OpenSDAコミュニティの投稿 をご覧ください。
1.2 FRDM-K64F開発ボードのスタート・ガイド
実際にFRDM-K64Fを使ってみましょう!ショート・ビデオで手順を視聴するか、以下に記載された詳細な手順を参考にして、作業を進めてください。
1.4 クイック・スタート・デモを実行する
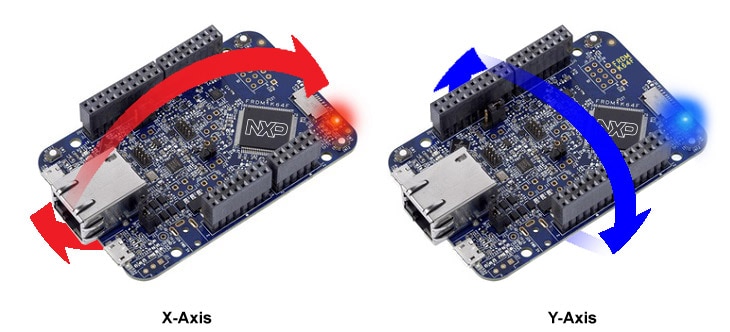
FRDM-K64Fには、オンボード加速度センサを利用した「水準器」のデモが搭載されています。ボードが水平の場合、RGB LEDはオフのままです。ボードが傾いている場合、X軸の傾きに応じて赤色のLEDが、Y軸の傾きに応じて青色のLEDが点灯します。
2. ソフトウェアの入手
開発方法を選択します。
Kinetisソフトウェア開発キット (SDK) + 統合開発環境 (IDE)
詳細情報:
- SWDとJTAGによるデバッグ・サポート
- 柔軟性の高いソフトウェア
- ペリフェラル・ドライバ一式(ソース・コードあり)
- アプリケーション・サンプルとプロジェクト・ファイル
Zephyr™ OS
詳細情報 :
- 拡張性に優れたオープンソースのリアルタイム・オペレーティング・システム (RTOS)
- 複数のハードウェア・アーキテクチャをサポート
- リソースに制約のあるデバイス向けに最適化
- セキュリティを重視した設計
Arm Mbedオンライン開発サイト
詳細情報 :
- オンライン・コンパイラ(SWDやJTAGのデバッグなし)
- シンプルで高度に抽象化されたプログラミング・インターフェース
- 制限はあるが使いやすいドライバ(ソース・コードあり)
- コミュニティに投稿されたサンプル・コード
2.1 FRDM-K64F用ソフトウェアをインストールする
2.2 MCUXpresso SDKですぐに設計を開始する
下のボタンをクリックして、 FRDM-K64F用に事前設定済みのSDKリリースをダウンロードしてください。SDKの詳細はこちら。
MCUXpressoソフトウェアSDKは無償で利用することができ、オープンソースのライセンスに基づいて、すべてのハードウェア抽象化およびペリフェラル・ドライバ・ソフトウェアのソース・コード全体が提供されます。

2.3 ツールチェーンをインストールする
NXPは、MCUXpresso IDEというツールチェーンを無償で提供しています。
別のツールチェーンを使用したい場合は?
問題ありません。MCUXpresso SDKは、IAR、Keil、コマンドラインGCCなどの他のツールをサポートしています。

2.4 MCUXpresso Config Tools
MCUXpresso Config Toolsは、ユーザーがMCUXpresso SDKプロジェクトを新規に作成するための構成ツールの統合スイートであり、カスタム・ボード・サポート用の初期化Cコードを生成するためのピンとクロックのツールも備えています。

2.5 PCの設定
サンプル・アプリケーションの多くは、マイクロコントローラのUARTを介してデータを出力します。ボードの仮想COMポート用ドライバがインストールされているか必ず確認してください。ドライバのインストーラを実行する前に、ボードをPCに接続しておく必要があります。
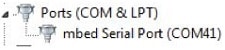
シリアル・ポート・ドライバをインストールした状態で、お好きなターミナル・アプリケーションを実行し、マイクロコントローラのUARTからのシリアル出力を確認します。ターミナルをボーレート115,200、8データ・ビット、パリティなし、1ストップ・ビットに設定します。FRDM-K64Fの仮想COMポートのポート番号を決定するには、デバイス・マネージャを開き、「Ports(ポート)」グループを確認します。
ターミナル・アプリケーションの使用方法がわからない場合は、Tera TermチュートリアルまたはPuTTYチュートリアルのいずれかのチュートリアルをお試しください。
3. ビルドと実行
3.1 FRDM-K64Fでのデモのビルドと実行
3.2 MCUXpresso SDKサンプル・コードを確認する
MCUXpresso SDKには、サンプル・アプリケーション・コードが豊富に用意されています。利用可能なコードを確認するには、SDKをインストールしたフォルダのSDKボード・フォルダを参照し、FRDM-K64Fボードを選択します (
特定のサンプル・コードの詳細については、サンプルのディレクトリにあるreadme.txtファイルを開いてください。
3.3 MCUXpresso SDKサンプルのビルド、実行、およびデバッグ
興味のあるデモ・アプリケーションやドライバのサンプルがいくつかあれば、それをビルドおよびデバッグする方法を知りたくなることでしょう。MCUXpresso SDKのスタート・ガイドでは、SDKでサポートされているすべてのツールチェーンのデモを設定、ビルド、およびデバッグする方法について、わかりやすく手順に沿って解説しています。
以下のガイドを使用して、MCUXpresso IDEを使用してサンプル・アプリケーションを開いてビルドやデバッグを行う方法を習得してください。
MCUXpresso IDEを使用する
MCUXpresso SDKのインポート
- MCUXpresso IDEを開きます
- MCUXpresso IDEウィンドウ内のビューを[Installed SDKs(インストール済みSDK)]に切り替えます
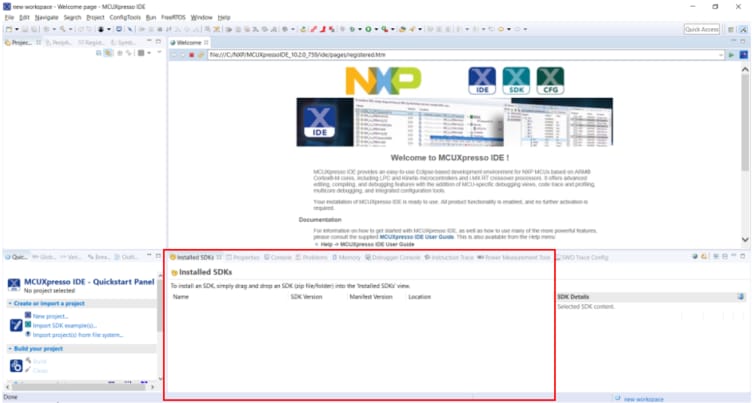
- Windowsエクスプローラを開き、FRDM-K64F SDKの(展開済みの)ファイルを[Installed SDKs(インストール済みSDK)]ビューにドラッグ&ドロップします
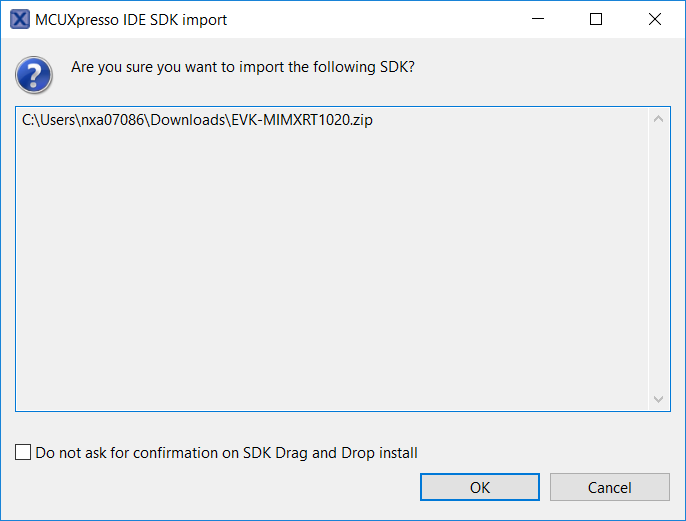
- 次のポップアップが表示されます。[OK]をクリックしてインポートを続行します。
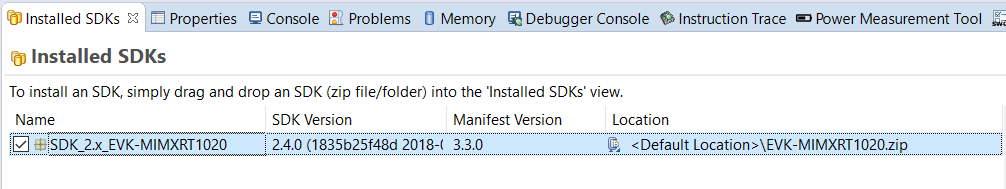
- インストールされたSDKは、以下に示すように[Installed SDKs(インストール済みSDK)]ビューに表示されます。
サンプル・アプリケーションのビルド
次の手順に従ってhello_worldサンプルを開きます。
-
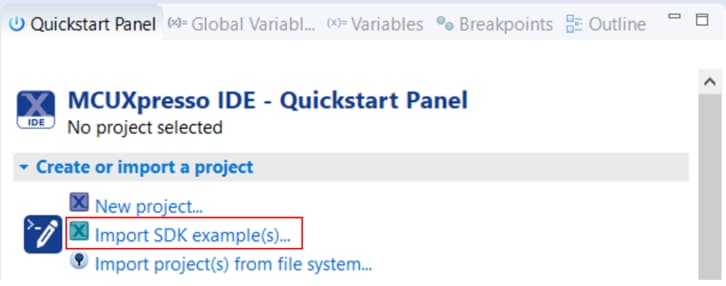
左下隅にある「Quickstart Panel(クイックスタート・パネル)」を確認します
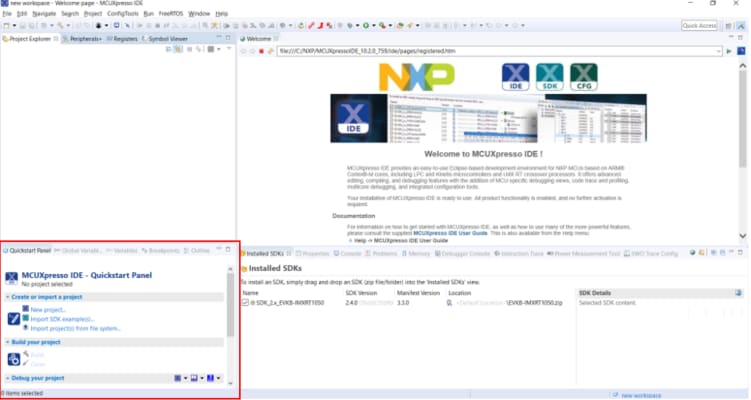
-
その中の[Import SDK example(s)(SDKサンプルのインポート)]をクリックします
-
サンプルをインポートして実行させるボードとして、
frdmk64fボードをクリックして選択し、[Next(次へ)]をクリックします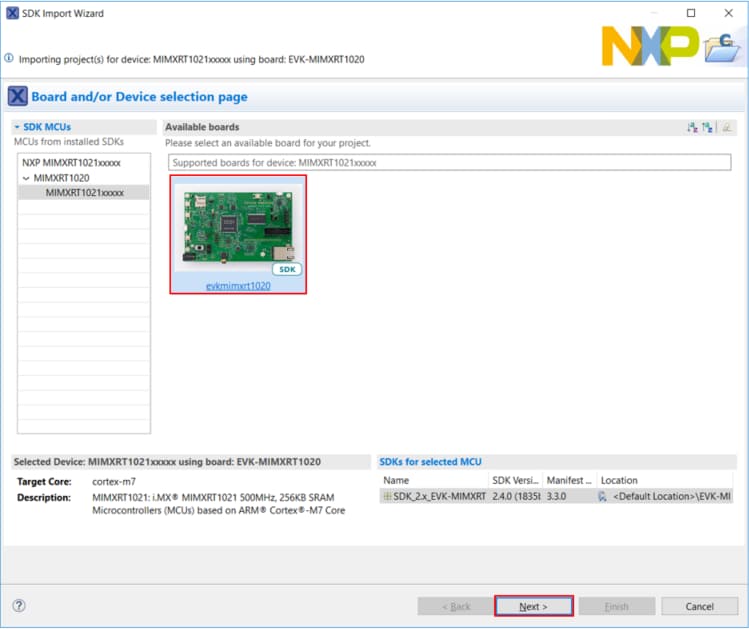
-
矢印ボタンを使用して[demo_apps]カテゴリを展開し、
hello_worldの横にあるチェックボックスをクリックしてそのプロジェクトを選択します。出力用にデフォルトのセミホスティングではなくUARTを使用するには、[Project Options(プロジェクト・オプション)]にある[Enable semihost(セミホストを有効にする)]チェックボックスのチェックを外します。[Next(次へ)]をクリックします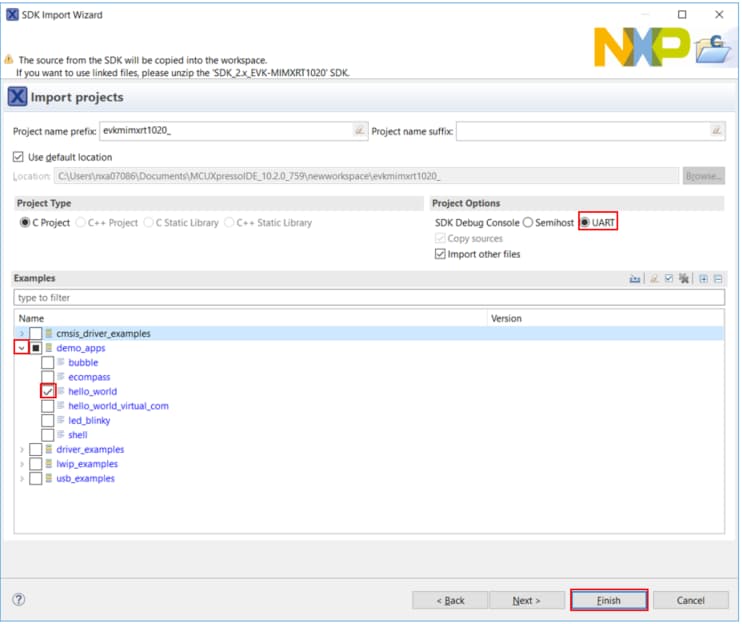
-
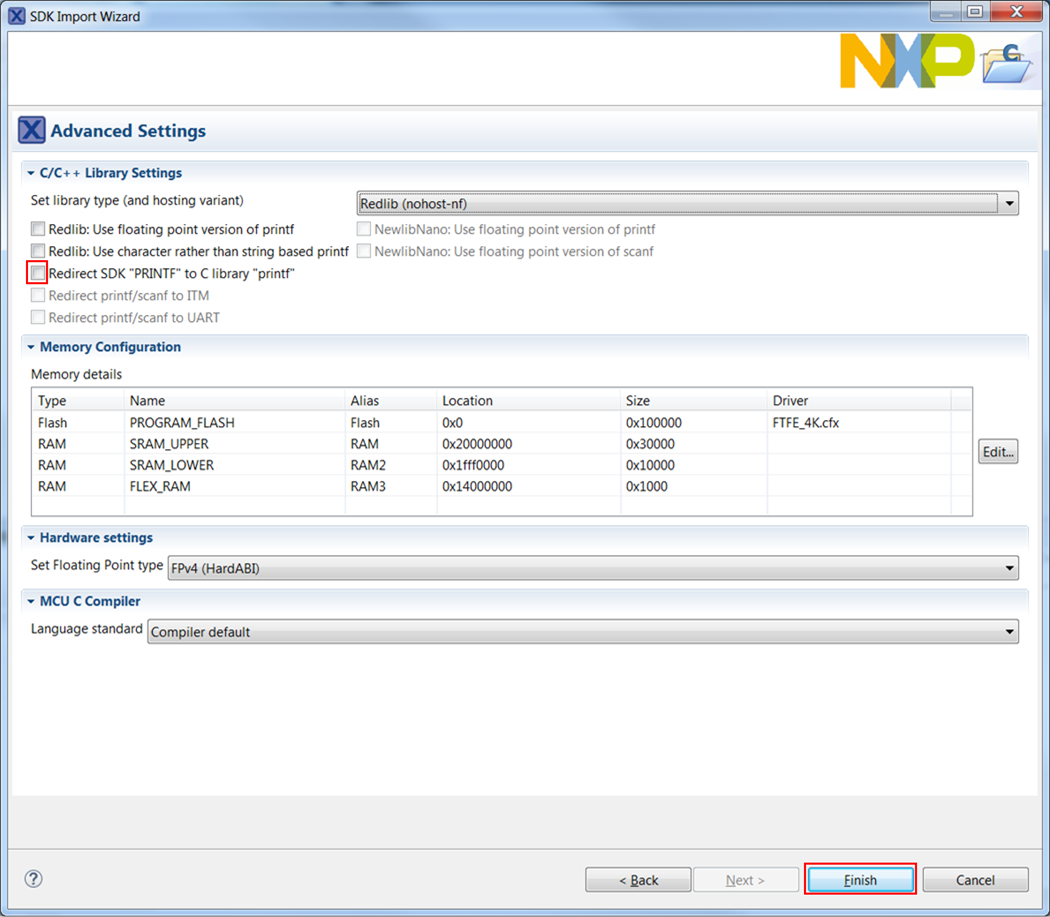
出力用にCライブラリの一般的な機能の代わりにMCUXpresso SDKのコンソール機能を使用するには、「Advanced Settings(詳細設定)」ウィザードで、[Redirect SDK “PRINTF” to C library “printf”(SDKの「PRINTF」をCライブラリの「printf」にリダイレクトする)]チェックボックスのチェックを外します。[Finish(完了)]をクリックします
-
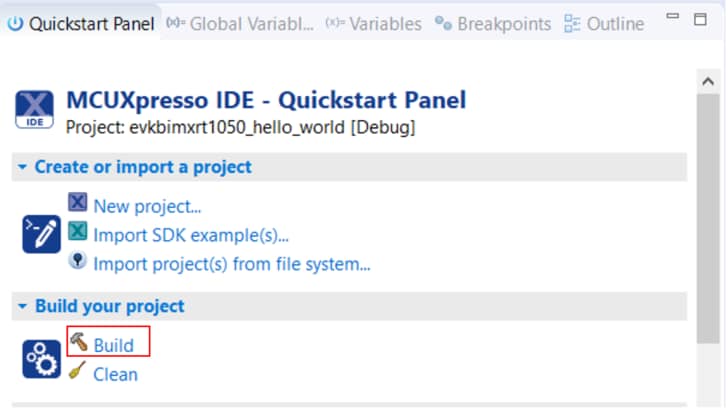
ここで、プロジェクト名をクリックし、[Build(ビルド)]アイコンをクリックして、プロジェクトをビルドします
-
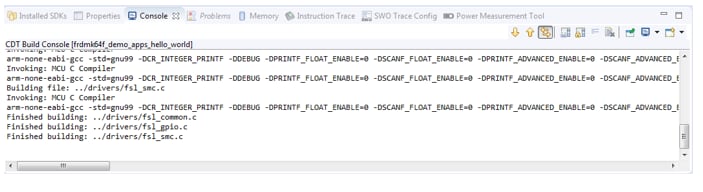
ビルドの進捗状況は[Console(コンソール)]タブで確認できます
サンプル・アプリケーションの実行
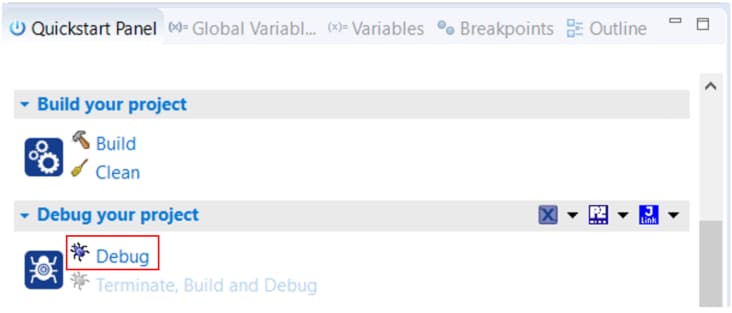
- プロジェクトがコンパイルされたので、ボードにフラッシュしてプロジェクトを実行できます
- FRDM-K64Fボードが接続されていることを確認し、プロジェクトを選択したら、[Debug(デバッグ)]をクリックして、「frdmk64f_demo_apps_hello_world」をデバッグします
-
MCUXpresso IDEは接続されたボードを確認し、FRDM-K64Fに統合されたOpenSDA回路の一部であるMBED CMSIS-DAPデバッグ・プローブを検出します。[OK]をクリックして続行します
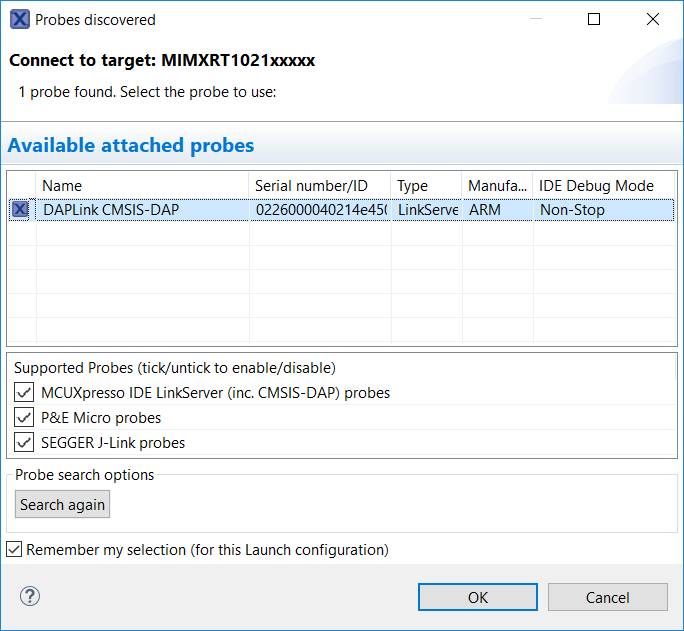
-
ファームウェアがボードにダウンロードされ、デバッガが起動します
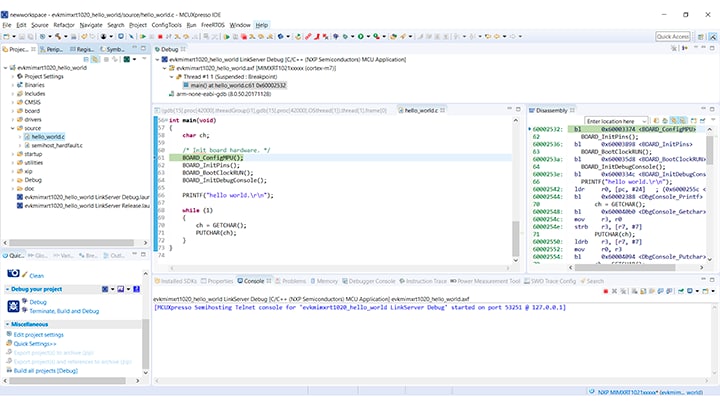
-
ターミナル・プログラムを開き、ボードがカウントしたCOMポートに接続します。ボーレート115,200、8データ・ビット、パリティなし、1ストップ・ビットを使用します
-
[Resume(再開)]ボタンをクリックして、アプリケーションを起動します。
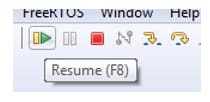
-
hello_worldアプリケーションが実行され、ターミナルにバナーが表示されます。表示されない場合は、ターミナルの設定と接続を確認してください
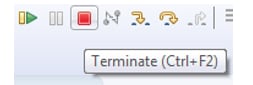
-
命令の一時停止、ステップ・イン、ステップ・オーバーを行うにはメニュー・バーのコントロールを使用します。デバッグ・セッションを停止するには、[Terminate(終了)]アイコンをクリックします。
別のツールチェーンを使用する場合:
IARを使用してデモを実行する
サンプル・アプリケーションのビルド
次の手順に従ってhello_worldアプリケーションを開きます。他のサンプル・アプリケーションでは、手順がわずかに異なる場合があります。アプリケーションによってはパスのフォルダ階層が深くなるためです。
-
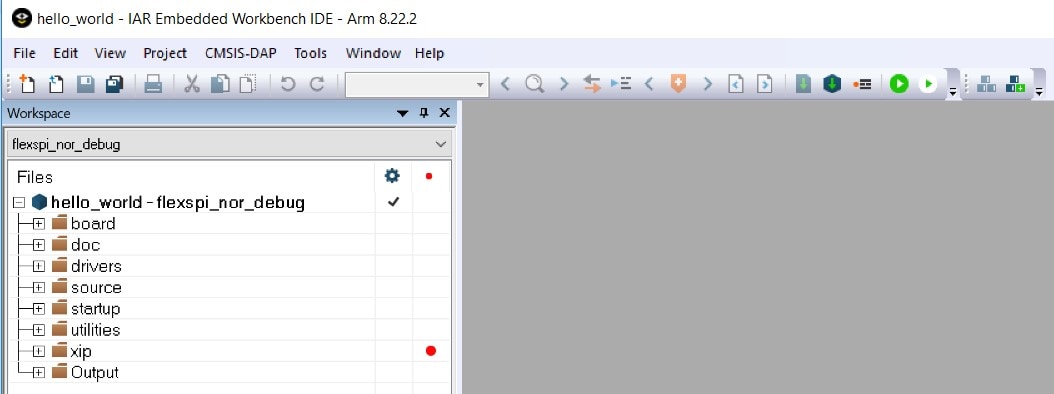
目的のサンプル・アプリケーション・ワークスペースをまだ開いていない場合はここで開きます。ほとんどのサンプル・アプリケーション・ワークスペースのファイルは、次のパスに置かれています。
/boards/ / / /iar hello_worldデモをサンプルとして使用する場合、パスは次のようになります。/boards/frdmk64f/demo_apps/hello_world/iar -
ドロップダウン・リストから、目的のビルド・ターゲットを選択します。ここでは、「hello_world - Debug」ターゲットを選択します
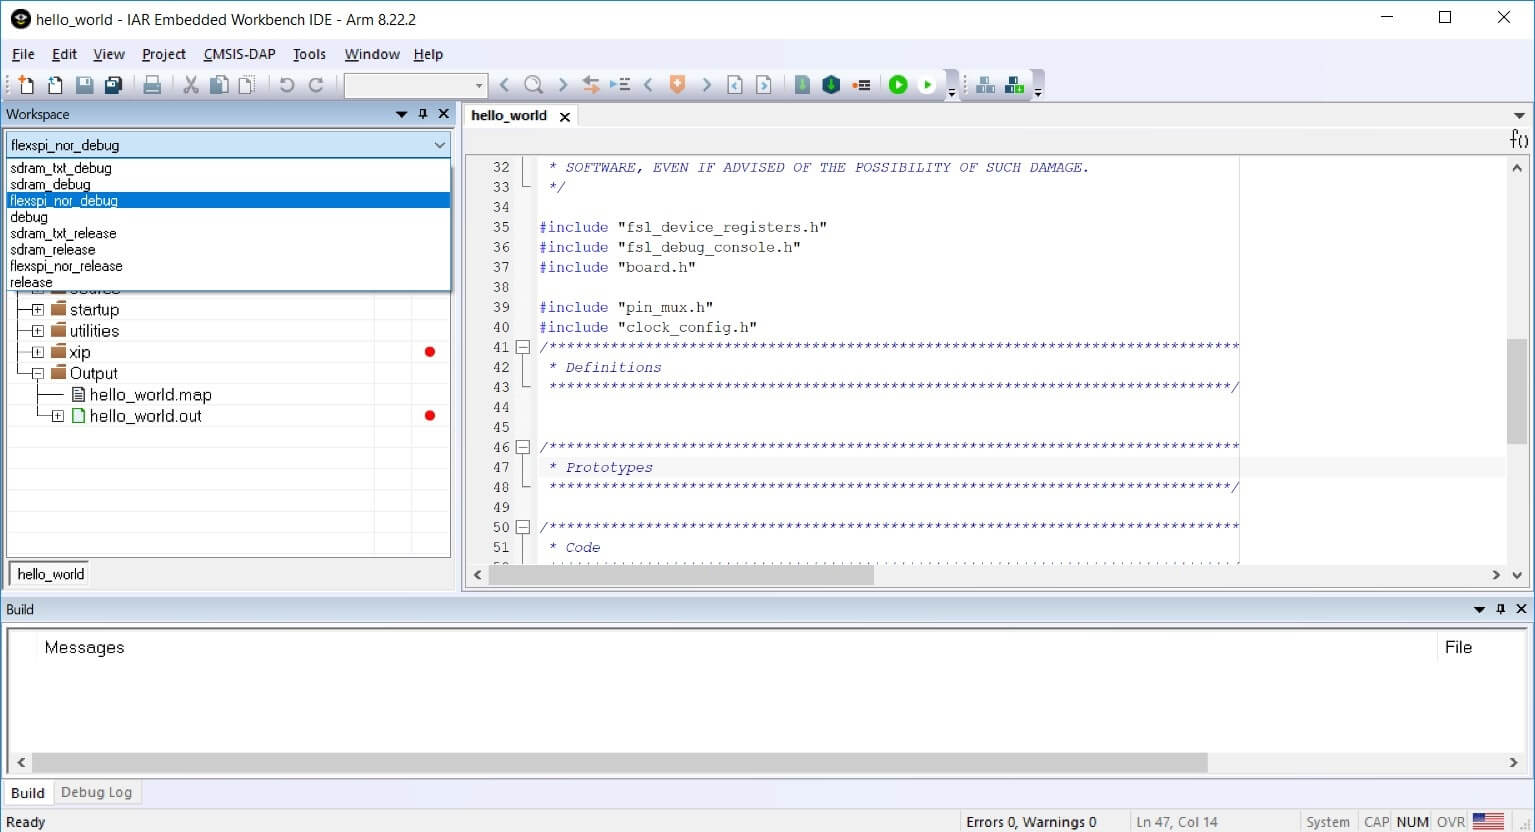
-
アプリケーションをビルドするには、下の図で赤色でハイライト表示されている[Make(作成)]ボタンをクリックします
-
ビルドが正常に完了します
サンプル・アプリケーションの実行
FRDM-K64Fボードには、工場出荷時にmbed/CMSIS-DAPデバッグ・インターフェースが搭載されています。ボードのデバッグOpenSDAアプリケーションを変更している場合、OpenSDAにアクセスして、ボードを更新または工場出荷時の状態に復元する方法をご確認ください。
-
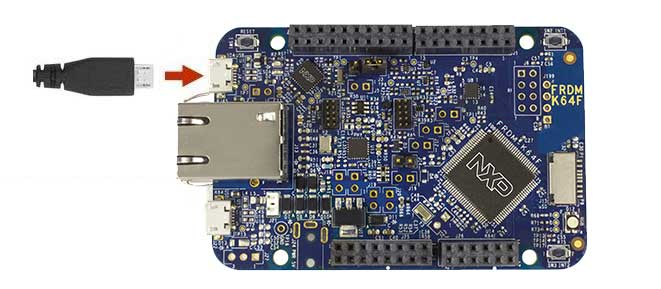
開発プラットフォームをPCに接続します。ボード上の「SDAUSB」USBポートとPCのUSBコネクタをUSBケーブルでつないでください
- PCのターミナル・アプリケーション(PuTTY、Tera Termなど)を開き、事前に確認したデバッグCOMポートに接続します。次の設定値を用いてターミナルを設定します。
- ボーレート115,200
- パリティなし
- 8データ・ビット
- 1ストップ・ビット
-
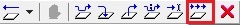
[Download and Debug(ダウンロードとデバッグ)]ボタンをクリックして、アプリケーションをターゲットにダウンロードします

-
アプリケーションがターゲットにダウンロードされると、自動的にmain()関数まで実行されます
-
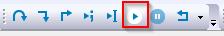
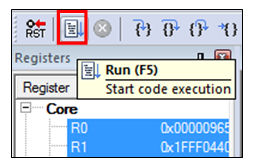
[Go(実行)]ボタンをクリックすると、コードが実行され、アプリケーションが起動します
hello_worldアプリケーションが実行され、ターミナルにバナーが表示されます。表示されない場合は、ターミナルの設定と接続を確認してください
Keil® MDK/µVision®を使用してデモを実行する
CMSISデバイス・パックのインストール
MDKツールをインストールした後、デバッグ目的でデバイスを完全にサポートするには、CMSIS (Cortex® Microcontroller Software Interface Standard) デバイス・パックをインストールする必要があります。このパックには、メモリ・マップ情報、レジスタ定義、フラッシュ・プログラミング・アルゴリズムなどが含まれています。下記の手順に従って、適切なCMSISパックをインストールしてください。
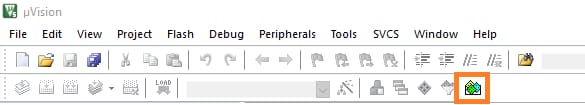
- µVisionという名前のMDK IDEを開きます。IDEで、[Pack Installer(パック・インストーラ)]アイコンを選択します
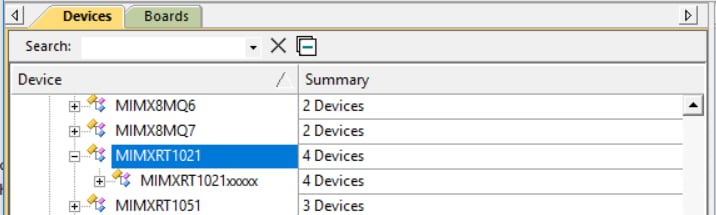
- [Pack Installer(パック・インストーラ)]ウィンドウで、Kinetisパックのセクションに移動します(アルファベット順に並んでいます)。Kinetisパックの名前は、「Keil::Kinetis」で始まり、MCUのファミリ名が続きます(「Keil::Kinetis_K60_DFP」など)。ここではFRDM-K64Fプラットフォームを使用するため、K60ファミリのパックを選択します。パックの横にある[Install(インストール)]ボタンをクリックします。このプロセスを正常に完了するには、インターネット接続が必要となります
- インストールが完了したら、[Pack Installer(パック・インストーラ)]ウィンドウを閉じて、µVision IDEに戻ります
サンプル・アプリケーションのビルド
次の手順に従ってhello_worldアプリケーションを開きます。他のサンプル・アプリケーションでは、手順がわずかに異なる場合があります。アプリケーションによってはパスのフォルダ階層が深くなるためです。
-
目的のデモ・アプリケーション・ワークスペースをまだ開いていない場合は以下で開きます。
/boards/ / / /mdk ワークスペース・ファイルの名前は、
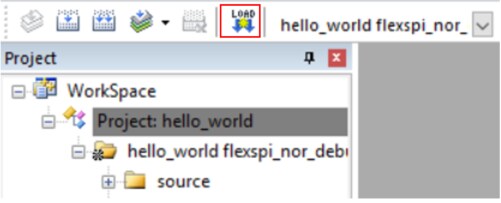
.uvmpwです。今回の例の場合、実際のパスは次のようになります。 /boards/frdmk64f/demo_apps/hello_world/mdk/hello_world.uvmpw - デモ・プロジェクトをビルドするには、赤色でハイライト表示されている[Rebuild(リビルド)]ボタンを選択します
- ビルドが正常に完了します

サンプル・アプリケーションの実行
FRDM-K64Fボードには、工場出荷時にmbed/CMSIS-DAPデバッグ・インターフェースが搭載されています。ボードのデバッグOpenSDAアプリケーションを変更している場合、OpenSDAにアクセスして、ボードを更新または工場出荷時の状態に復元する方法をご確認ください。
- 開発プラットフォームをPCに接続します。ボード上の「SDAUSB」USBポートとPCのUSBコネクタをUSBケーブルでつないでください
- PCのターミナル・アプリケーション(PuTTY、Tera Termなど)を開き、事前に確認したデバッグCOMポートに接続します。次の設定値を用いてターミナルを設定します。
- ボーレート115,200
- パリティなし
- 8データ・ビット
- 1ストップ・ビット
- アプリケーションが正しくビルドされたら、[Download(ダウンロード)]ボタンをクリックして、アプリケーションをターゲットにダウンロードします
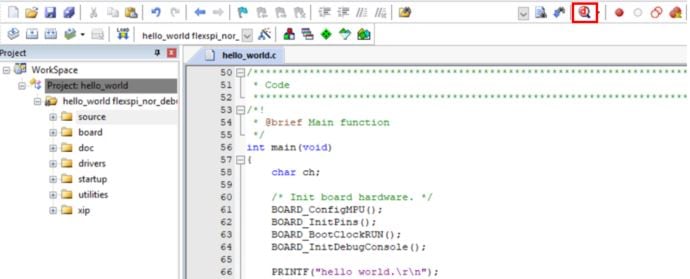
- [Download(ダウンロード)]ボタンをクリックすると、アプリケーションがターゲットにダウンロードされ、自動的に実行されます。アプリケーションをデバッグする場合、[Start/Stop Debug Session(デバッグ・セッションの開始/終了)]ボタン(赤色でハイライト表示)をクリックします
- [Run(実行)]ボタンをクリックすると、コードが実行され、アプリケーションが起動します
hello_worldアプリケーションが実行され、ターミナルにバナーが表示されます。表示されない場合は、ターミナルの設定と接続を確認してください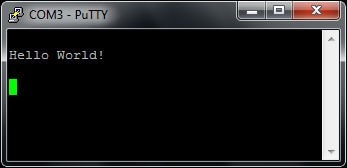
Armを使用してデモを実行する
ツールチェーンのセットアップ
ここでは、Kinetis SDKでサポートされているように、Arm GCCツールチェーンを使用してKSDKデモ・アプリケーションのビルドと実行を行う際に必要となるコンポーネントをインストールする手順について説明します。Arm GCCツールの使用方法はさまざまですが、今回の例では、Windows環境に焦点を当てています。ここでは省略しますが、GCCツールは、Linux OSやMac OS Xの環境でも利用できます。
GCC Arm Embeddedツールチェーンのインストール
GNU Arm Embeddedツールチェーン からインストーラをダウンロードして、実行します。これは実際のツールチェーンです(コンパイラ、リンカなど)。Kinetis SDKリリース・ノートに記載されている、サポート対象の最新バージョンのGCCツールチェーンを使用する必要があります。
MinGWのインストール
MinGW (Minimalist GNU for Windows) 開発ツールは、サード・パーティ製のCランタイムDLL(Cygwinなど)に依存しないツール・セットを備えています。KSDKで使用されているビルド環境ではMinGWビルド・ツールを使用せず、MinGWとMSYSのベース・インストールを活用しています。MSYSは、UNIX系のインターフェースと各種ツールを備えた基本シェルを提供します。
- MinGW - Minimalist GNU for Windowsファイルから最新の
MinGW mingw-get-setupインストーラをダウンロードしてください - インストーラを実行します。インストール・パスとしては
C:\MinGWを推奨しますが、他のどの場所にでもインストールできます - [Basic Setup(基本セットアップ)]で、
mingw32-baseとmsys-baseが選択されていることを確認します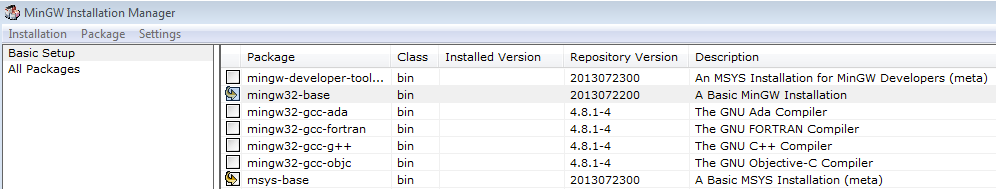
- [Installation(インストール)]メニューで[Apply Changes(変更を適用)]をクリックし、残りの手順に従って、インストールを完了します
-
Windows OSのPath環境変数に適切なアイテムを追加します。これは、[Control Panel(コントロール・パネル)]>[System and Security(システムとセキュリティ)]>[System(システム)]>[Advanced System Settings(システムの詳細設定)]の[Environment Variables(環境変数)]セクションで設定します。パスは次のとおりです。
\bin デフォルトのインストール・パスである
C:\MinGWを使用した例を以下に示します。パスが正しく設定されていないと、ツールチェーンは機能しません。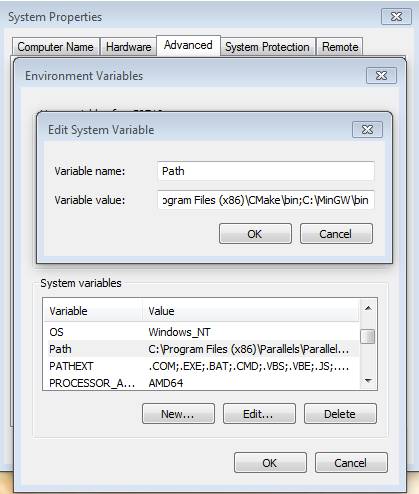
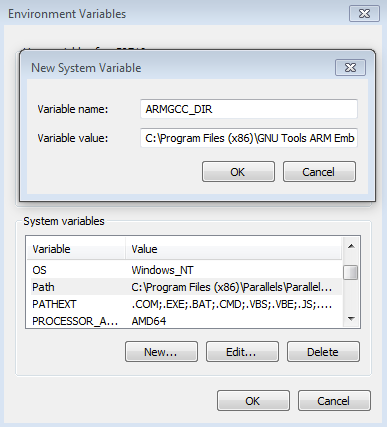
ARMGCC_DIR向けの新しい環境変数を追加する
- 新しいシステム環境変数を作成して、「ARMGCC_DIR」という名前を付けます。この変数の値で、Arm GCC Embeddedツールチェーンのインストール・パスを指定します。今回の例では、次のようになります。
C:\Program Files (x86)\GNU Tools Arm Embedded\4.9 2015q3 - インストール・フォルダの正確なパス名については、GNU Arm GCC Embeddedツールのインストール・フォルダを参照してください
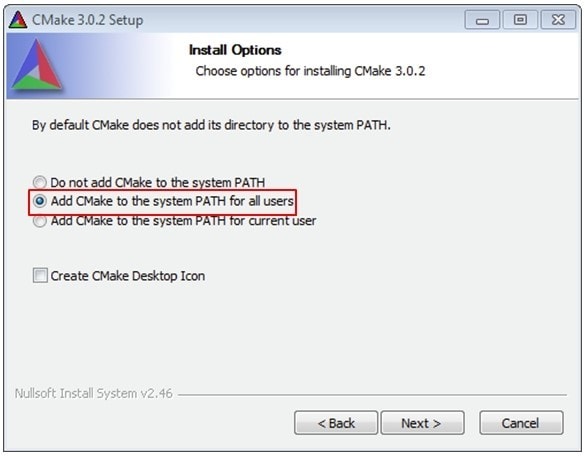
CMakeのインストール
-
CMakeからCMake 3.0.xをダウンロードします
-
CMakeをインストールします。インストール時には、必ず[Add CMake to system PATH(CMakeをシステムPATHに追加)]オプションを選択します。すべてのユーザーが使用できるパスにインストールするか、現在のユーザーのみが使用できるパスにインストールするかは、ユーザーが選択します。今回の例では、すべてのユーザーに対してインストールしています
-
インストーラの残りの手順に従います
-
PATHの変更を適用するには、システムの再起動が必要になる場合があります
サンプル・アプリケーションのビルド
サンプル・アプリケーションをビルドする手順は次のとおりです。
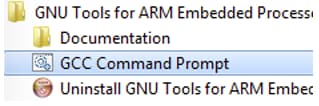
- GCC Arm Embeddedツールチェーンのコマンド・ウィンドウが開いていない場合はここで開きます。ウィンドウを開くには、Windows OSの[スタート]メニューから、[プログラム]>[GNU Tools Arm Embedded
]に移動して、[GCC Command Prompt(GCCコマンド・プロンプト)]を選択します 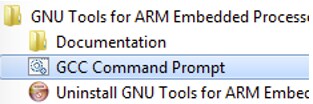
-
サンプル・アプリケーションのプロジェクト・ディレクトリに移動します。パスは次のようになります。
/boards/ / / /armgcc このガイドの場合、実際のパスは次のようになります。
/boards/frdmk64f/demo_apps/hello_world/armgcc - コマンドラインで「
build_debug.bat」と入力するか、Windows OSのエクスプローラでbuild_debug.batファイルをダブルクリックして、ビルドを実行します。次のような出力画面が表示されます。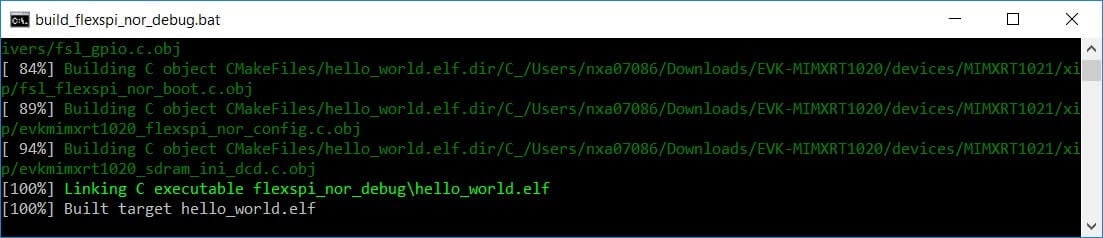
サンプル・アプリケーションの実行
GCCツールを使用するには、J-Linkデバッグ・インターフェースが必要となります。ボードのOpenSDAファームウェアを最新のJ-Linkアプリケーションにアップデートするには、OpenSDAにアクセスしてください。J-Link OpenSDAアプリケーションをインストールしたら、「SEGGER Downloads」からJ-Linkドライバとソフトウェア・パッケージをダウンロードします。
- 開発プラットフォームをPCに接続します。ボード上の「SDAUSB」USBポートとPCのUSBコネクタをUSBケーブルでつないでください
- PCのターミナル・アプリケーション(PuTTY、Tera Termなど)を開き、事前に確認したデバッグCOMポートに接続します。次の設定値を用いてターミナルを設定します。
- ボーレート115,200
- パリティなし
- 8データ・ビット
- 1ストップ・ビット
- J-Link GDBサーバ・アプリケーションを開きます。J-Linkソフトウェアがインストールされている場合、Windows OSの[スタート]メニューに移動し、[プログラム]>[SEGGER]>[J-Link
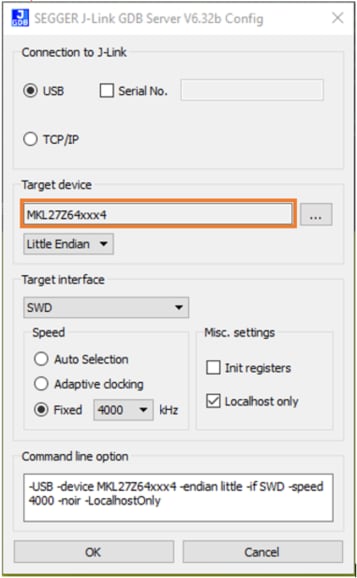
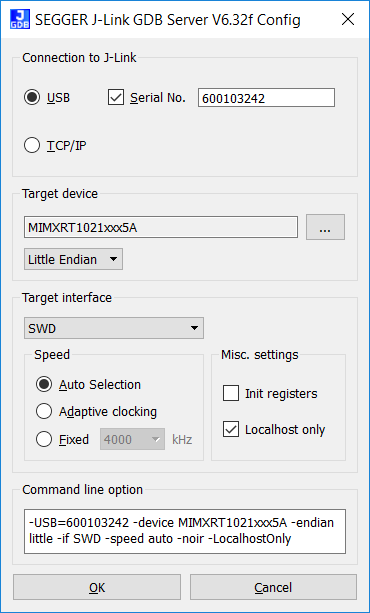
J-Link GDB Server]を選択するとアプリケーションを起動できます - 次のように設定を変更します。この例で選択されているターゲット・デバイスは、「MK64FN1M0xxx12」であり、SWDインターフェースを使用しています
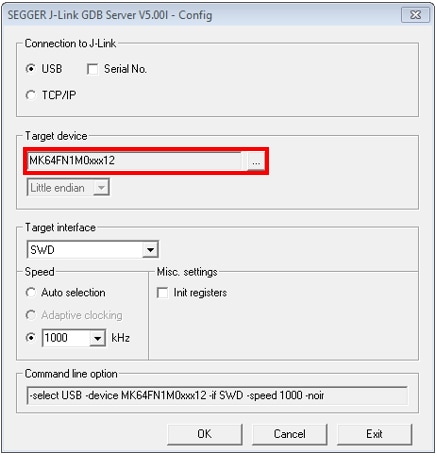
- 接続すると、画面は次の図のようになります。
- GCC Arm Embeddedツールチェーンのコマンド・ウィンドウが開いていない場合はここで開きます。ウィンドウを開くには、Windows OSの[スタート]メニューから、[プログラム]>[GNU Tools Arm Embedded
]に移動して、[GCC Command Prompt(GCCコマンド・プロンプト)]を選択します -
デモ・アプリケーションの出力を格納するディレクトリに変更します。出力は、選択したビルド・ターゲットに応じて、次のいずれかのパスに格納されます。
/boards/ / / /armgcc/debug /boards/ / / /armgcc/release このガイドの場合、パスは次のようになります。
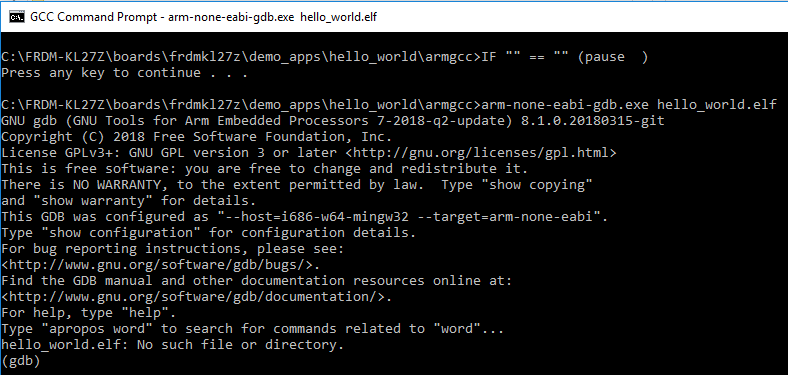
/boards/frdmk64f/demo_apps/hello_world/armgcc/debug - 「
arm-none-eabi-gdb.exe」コマンドを実行します。この例の場合、「.elf arm-none-eabi-gdb.exe hello_world.elf」というコマンドになります -
次のコマンドを実行します。
- target remote localhost:2331
- monitor reset
- monitor halt
- load
- monitor reset
- アプリケーションがダウンロードされ、リセット・ベクタで停止します。「monitor go」コマンドを実行すると、サンプル・アプリケーションが起動します
hello_worldアプリケーションが実行され、ターミナル・ウィンドウにバナーが表示されます

セキュリティ
セキュリティ・リソース
アプリケーションに適したレベルのセキュリティをNXPおよびIAR Systemsとともに構築する。今日のIoTセキュリティ要件の基準となっている要素と、NXPが市場の要求に対応するために汎用MCUに統合している基本セキュリティ機能について説明しています。
EdgeLock® SE050とFRDM-K64Fのスタート・ガイド。OM-SE050ARDとFRDM-K64F MCUボードを使用した、EdgeLock SE050 Plug & Trustミドルウェアのスタート・ガイド。
ブート・オプション
ブート・オプション・リソース
FRDMK64F SDブート・ローダ 。このドキュメントでは、FRDM-K64Fをベースとしたシンプルなブート・ローダと、それを使用してアプリケーション・コードを更新する方法について説明します。
Tera Termチュートリアル
Tera Termチュートリアル
Tera Termは、広く利用されているオープンソースのターミナル・エミュレーション・アプリケーションです。このプログラムを使用して、NXP開発プラットフォームの仮想シリアル・ポートから送信された情報を表示できます。
- SourceForgeからTera Termをダウンロードします。ダウンロードしたら、インストーラを実行し、このウェブページに戻って手順を続行します
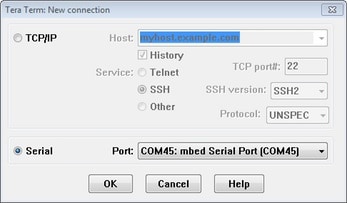
- Tera Termを起動します。初めて起動する際には、次のダイアログが表示されます。[Serial(シリアル)]オプションを選択します。ボードが接続されている場合は、COMポートが自動的にリスト内に表示されます
- 事前に確認したCOMポート番号を使用して、シリアル・ポートをボーレート115,200、8データ・ビット、パリティなし、1ストップ・ビットに設定します。この設定は[Setup(セットアップ)]>[Serial Port(シリアル・ポート)]から行うことができます
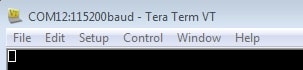
- 接続が確立されているか検証します。確立されている場合、Tera Termのタイトル・バーに次のように表示されます
- 以上で設定は完了です
PuTTYチュートリアル
PuTTYチュートリアル
PuTTYは、広く利用されているターミナル・エミュレーション・アプリケーションです。このプログラムを使用して、NXP開発プラットフォームの仮想シリアル・ポートから送信された情報を表示できます。
- 下のボタンをクリックしてPuTTYをダウンロードします。ダウンロードしたら、インストーラを実行し、このウェブページに戻って手順を続行します
- 選択したダウンロードのタイプに応じて、ダウンロードした*.exeファイルをダブルクリックするか、[Start(スタート)]メニューから選択して、PuTTYを起動します
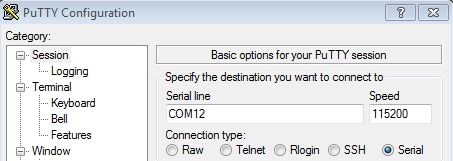
- 表示されたウィンドウで設定を行い、[Serial(シリアル)]ラジオ・ボタンを選択して、事前に確認したCOMポート番号を入力します。ボーレートもあわせて指定します。今回は115,200を入力します
- [Open(開く)]をクリックして、シリアル接続を確立します。ボードが接続されていて、正しいCOMポートが入力されていれば、ターミナル・ウィンドウが開きます。設定が正しくない場合は、アラートが表示されます
- 以上で設定は完了です
設計・リソース
ボードに関するドキュメント
チップに関するドキュメント
ソフトウェア
- FRDM-K64F向けMCUXpressoソフトウェア開発キット (SDK) 。MCUXpresso SDKについて、およびお使いのプロセッサや評価ボードに合わせてSDKをカスタマイズおよびダウンロードできるSDK Builderのスタート・ガイドについて詳しく説明しています。
サポート
トラブルシューティング
設計のヒントやトレーニング・ドキュメント、さらにNXPコミュニティを通じて、 FRDM-K64Fについての知識を深めることができます。不明な点がある場合は、NXPサポートにお問い合わせください。
お使いのボードは、下の図のような箱に入っていましたか?
問題ありません。ボードのパッケージングが古いだけで、フラッシュ・メモリには別のクイック・スタート・デモが搭載されています。
RGB LEDが、赤色、青色、緑色の3色に切り替わるはずです。他に問題がなければ、次のステップに進んでください。
まだ解決しませんか?
次のステップに進み、別のサンプル・アプリケーションを実行してみてください。それでも問題が解決しない場合は、NXPコミュニティ を通じてお問い合わせください。
トレーニング
MCUXpressoソフトウェアおよびツールの概要 。MCUXpresso SDK、IDE、およびConfig Toolsのスタート・ガイド。
フォーラム
NXPのいずれかのコミュニティ・サイトで、他のエンジニアとつながり、Kinetis K64Fを使用した設計に関する専門的なアドバイスを受けることができます。